
Photo by Siora Photography on Unsplash
By Eric van Heeswijk and Marc Wilson
Eric is an analyst and Marc is a partner at Global Advisors. Both are based in Johannesburg, South Africa.
This article is part of a Global Advisors series on strategy tools:
https://globaladvisors.biz/strategy-tools
Download this article:
Please fill in your details below and you will instantly be sent a link to download “The 'Price-Volume-Profit' Strategy Tool ” article.
Almost every person who has studied financial or management accounting at school or university is probably familiar with cost-volume-profit (CVP) analysis. It should be the basis of financial planning in most companies. However, in our experience, most managers do not apply the analysis and get it wrong in its most basic form (e.g. planning for similar / increased volumes together with price increases). The outcome? At best: results that fail to meet budgets. At worst: firms trigger the 'margin-price-volume death spiral'. Whether you are a production manager or a CEO, you should understand how CVP analysis applies to your firm. Your business's survival may be at stake.
The following represents typical theoretical CVP analysis and its depiction (classroom case – critical assumptions apply)
A basic CVP diagram depicting the components of a firm's profit equation
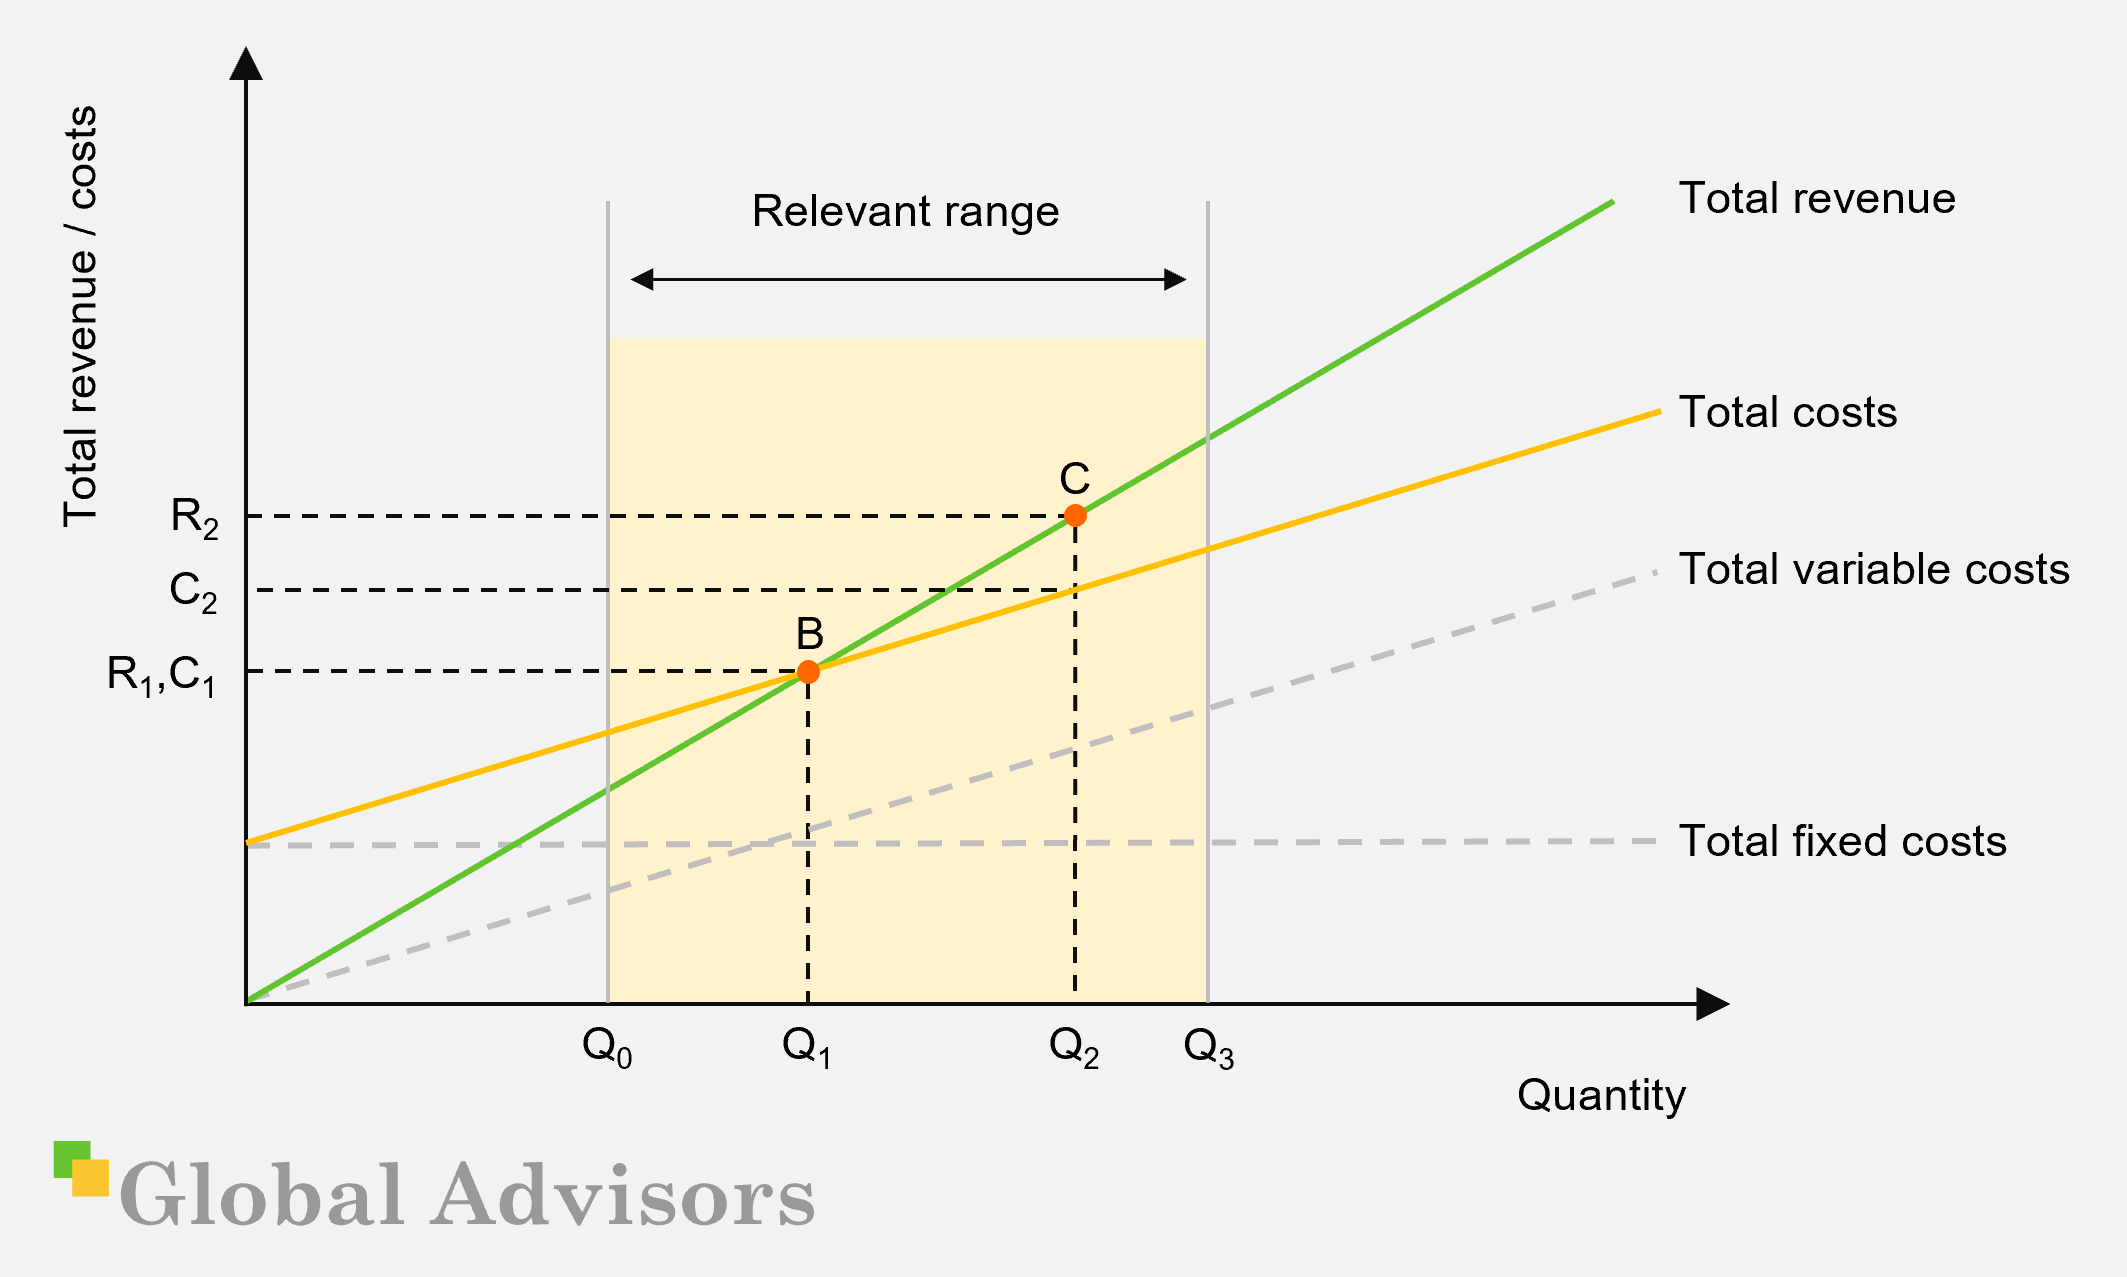
Total revenue
A straight line running through the origin. This represents revenue equalling quantity times price given the firm's current price.
Total variable costs
A straight line running through the origin. This represents quantity multiplied by variable cost per unit.
Total fixed costs
Total fixed costs can be interpreted as the costs of operating a firm's production capacity in the short run. Thus, the line runs parallel to the volume axis – fixed costs do not change with volume.
Total costs
The sum of fixed and variable costs – therefore equal to the variable cost curve shifted vertically upwards by fixed costs.
Breakeven
The point at which contribution (total revenue less total variable costs) covers fixed costs and the firm begins to make profit – the intersection of total revenue and total costs.
Relevant range
The analysis typically only holds for a limited change in volume. Large changes in volume relative to capacity tend to result in changes in fixed costs, unit costs and sometimes even pricing (see 'CVP assumptions' sidebar below).
Therefore – all other factors held equal:
- Increases in quantity result in movements along the revenue and cost curves. The vertical distance between the total revenue and total cost curve represents the profit or loss position for a given level of output and therefore increases with quantity.
- Changes in price result in a pivot of the revenue curve. An increase in price results in a greater level of revenue for each level of quantity output and vice versa for a reduction in price.
- Changes in variable costs result in a pivot of the total variable cost curve. An increase in costs therefore decreases profit – the gap between the revenue and total cost curve will narrow.
- Changes in fixed costs result in a vertical shift of the total cost curve. A reduction results in a downward shift, resulting in greater profits or reduced loses at every level of output. Vice versa for an increase in fixed costs.
Example
At output of Q1, the firm breaks even; R1 = C1
At an output of Q2, the firm makes a profit of R2 less C2
You know the theory: charge a price above your variable costs; the contribution margin pays down your fixed costs and what is left after breakeven is your profit. Simple, right? So, why do so many people get this wrong and why? Hold on tight.
While CVP analysis can be narrated, it is best (and typically) explained visually by means of three lines on a two-axis graph. The axes represent aggregate monetary value against aggregate volume. The classic depiction and its basic mechanics are explained in the sidebar. As volume rises, so do costs and revenues. Profit is shown as the excess of total revenue over total costs and in this base case, increased output results in increased profits.
Without a thorough understanding of a firm's CVP relationship, planning price changes is guesswork. In this paper, we'll focus on the critically important management insights and our experience of CVP's misapplication or lack of application.
CVP analysis and price
It is an accepted economic principle that raising price results in decreased volumes sold (for normal goods). The basis for this is the law of demand and an important measurement of its extent is the concept of price elasticity. The concept is that buyers react with varying degrees of sensitivity to changes in price with the formal definition being the percentage change in volume for a one percent change in price. We'll cover price elasticity and its applications in part 2 of this series.
In a theoretical sense, understanding the degree of pricing power in the context of market structure (i.e. whether the firm is a price taker or maker) is critical. This influences the depiction of the CVP curves but also applies is a more dynamic way in practice – factors like the degree of price following and market price history play a critical role in understanding price shifts in the context of CVP.
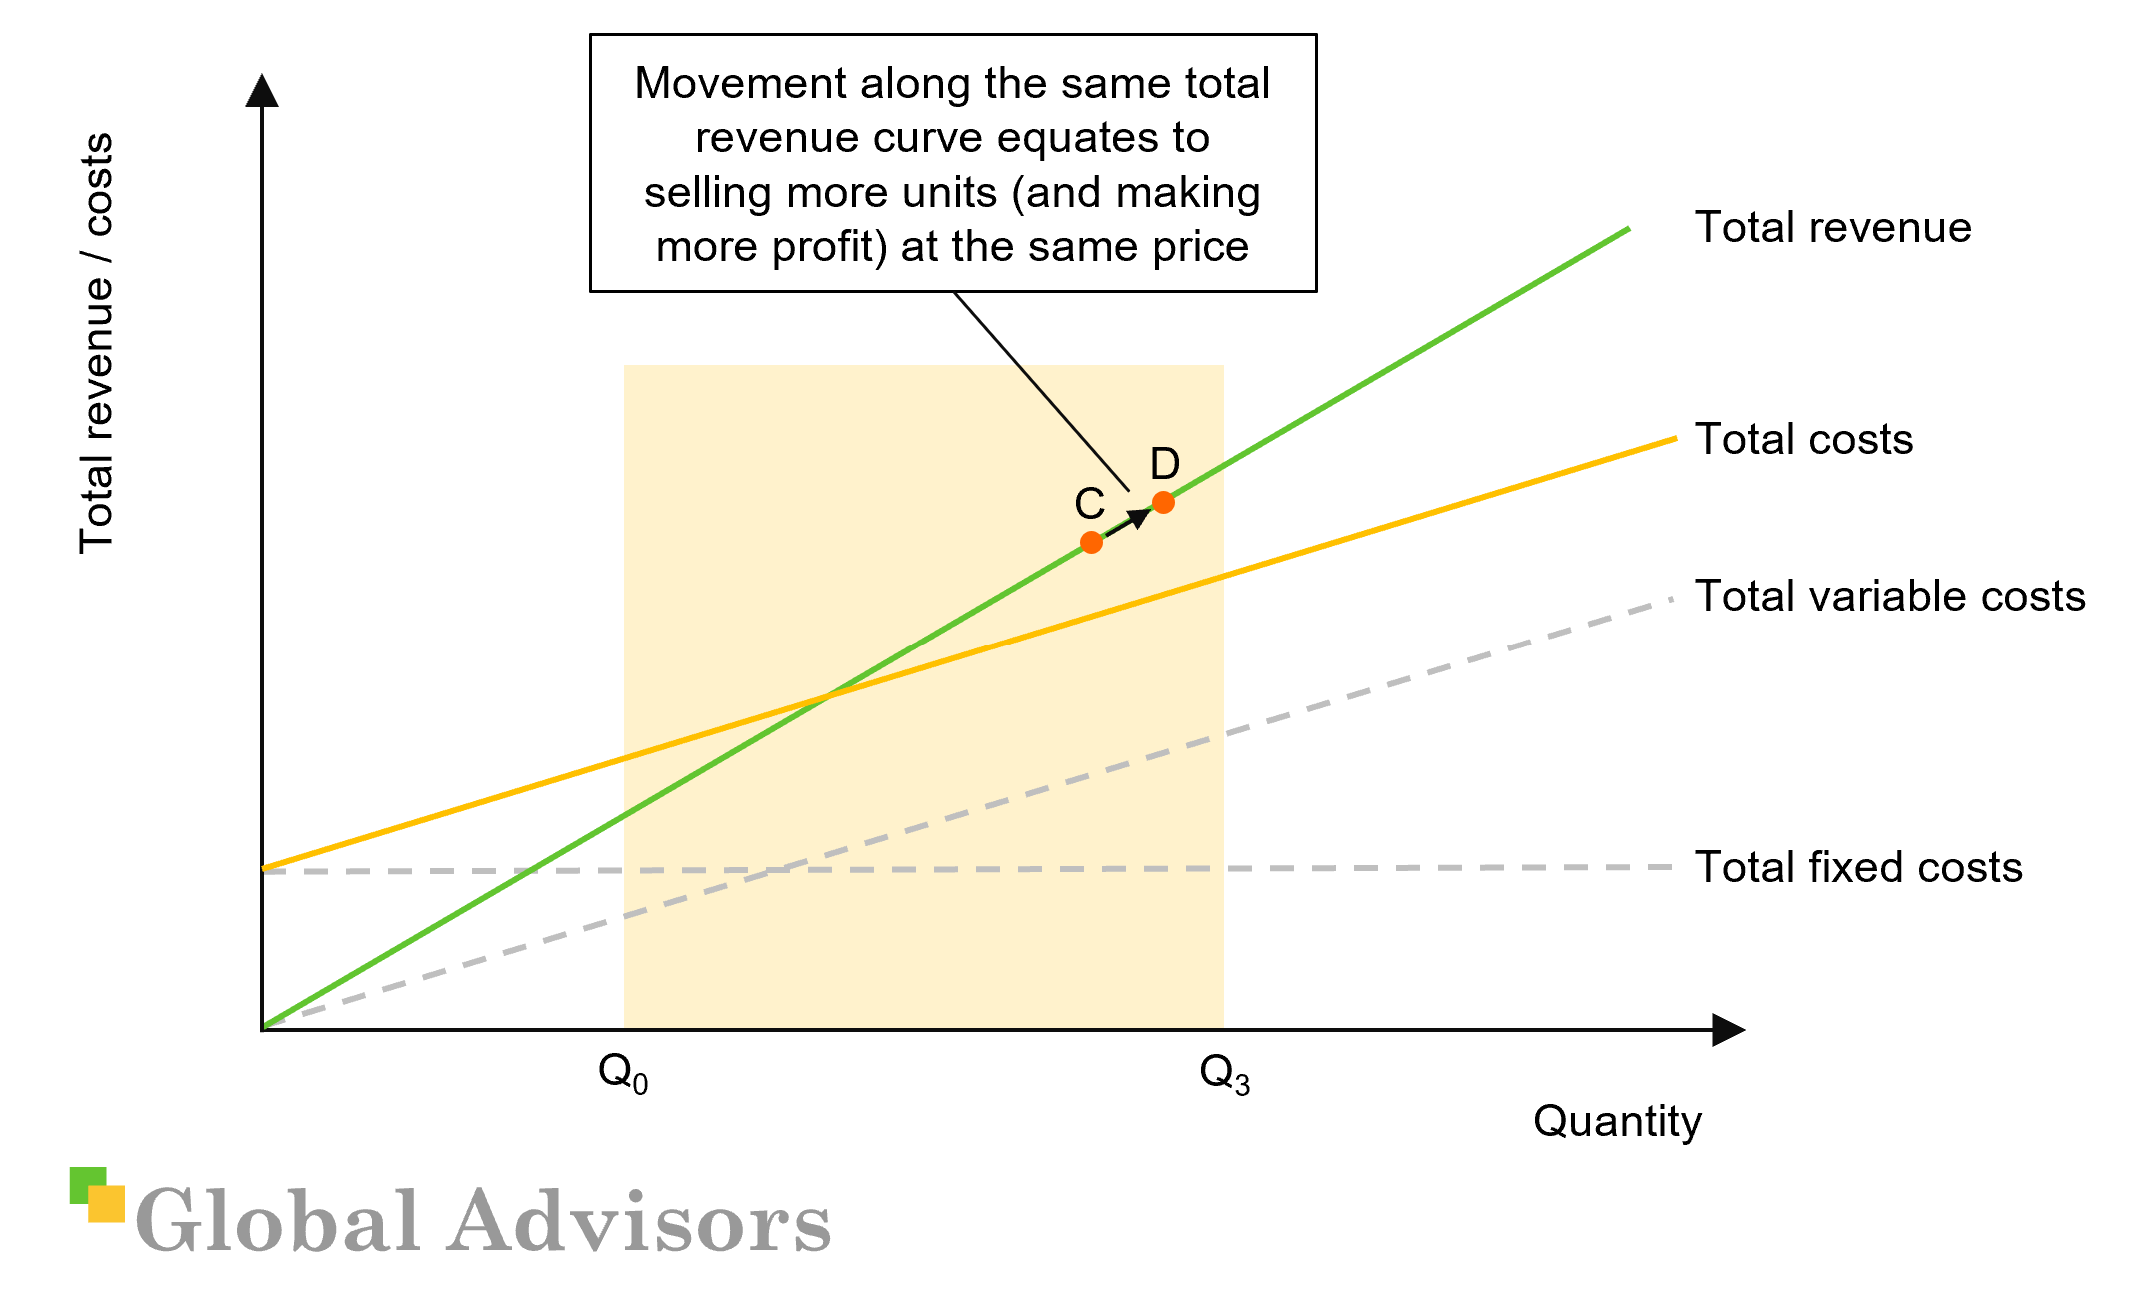
Firms may target volume increases without changing price by targeting unmet demand that exists through non-price factors. These include distribution, availability, product quality and many more. Such increases in volume represent a movement along the revenue and cost curves of the CVP model. This is a powerful concept as it demands an interrogation of what managers can do to maximize profitability before turning to price.
A basic CVP diagram with movement along the existing total revenue curve
When we change price, the revenue curve pivots (a new revenue curve for each change in price where the new slope is the new price). However, as price changes, we should also account for the corresponding changes in volume and each new revenue curve will have a single-point quantity based on the demand for the product at that price. The move from one point on one revenue curve to another is therefore based on the product's price elasticity.
A CVP diagram showing the effects of changes in price and elasticity on total revenue
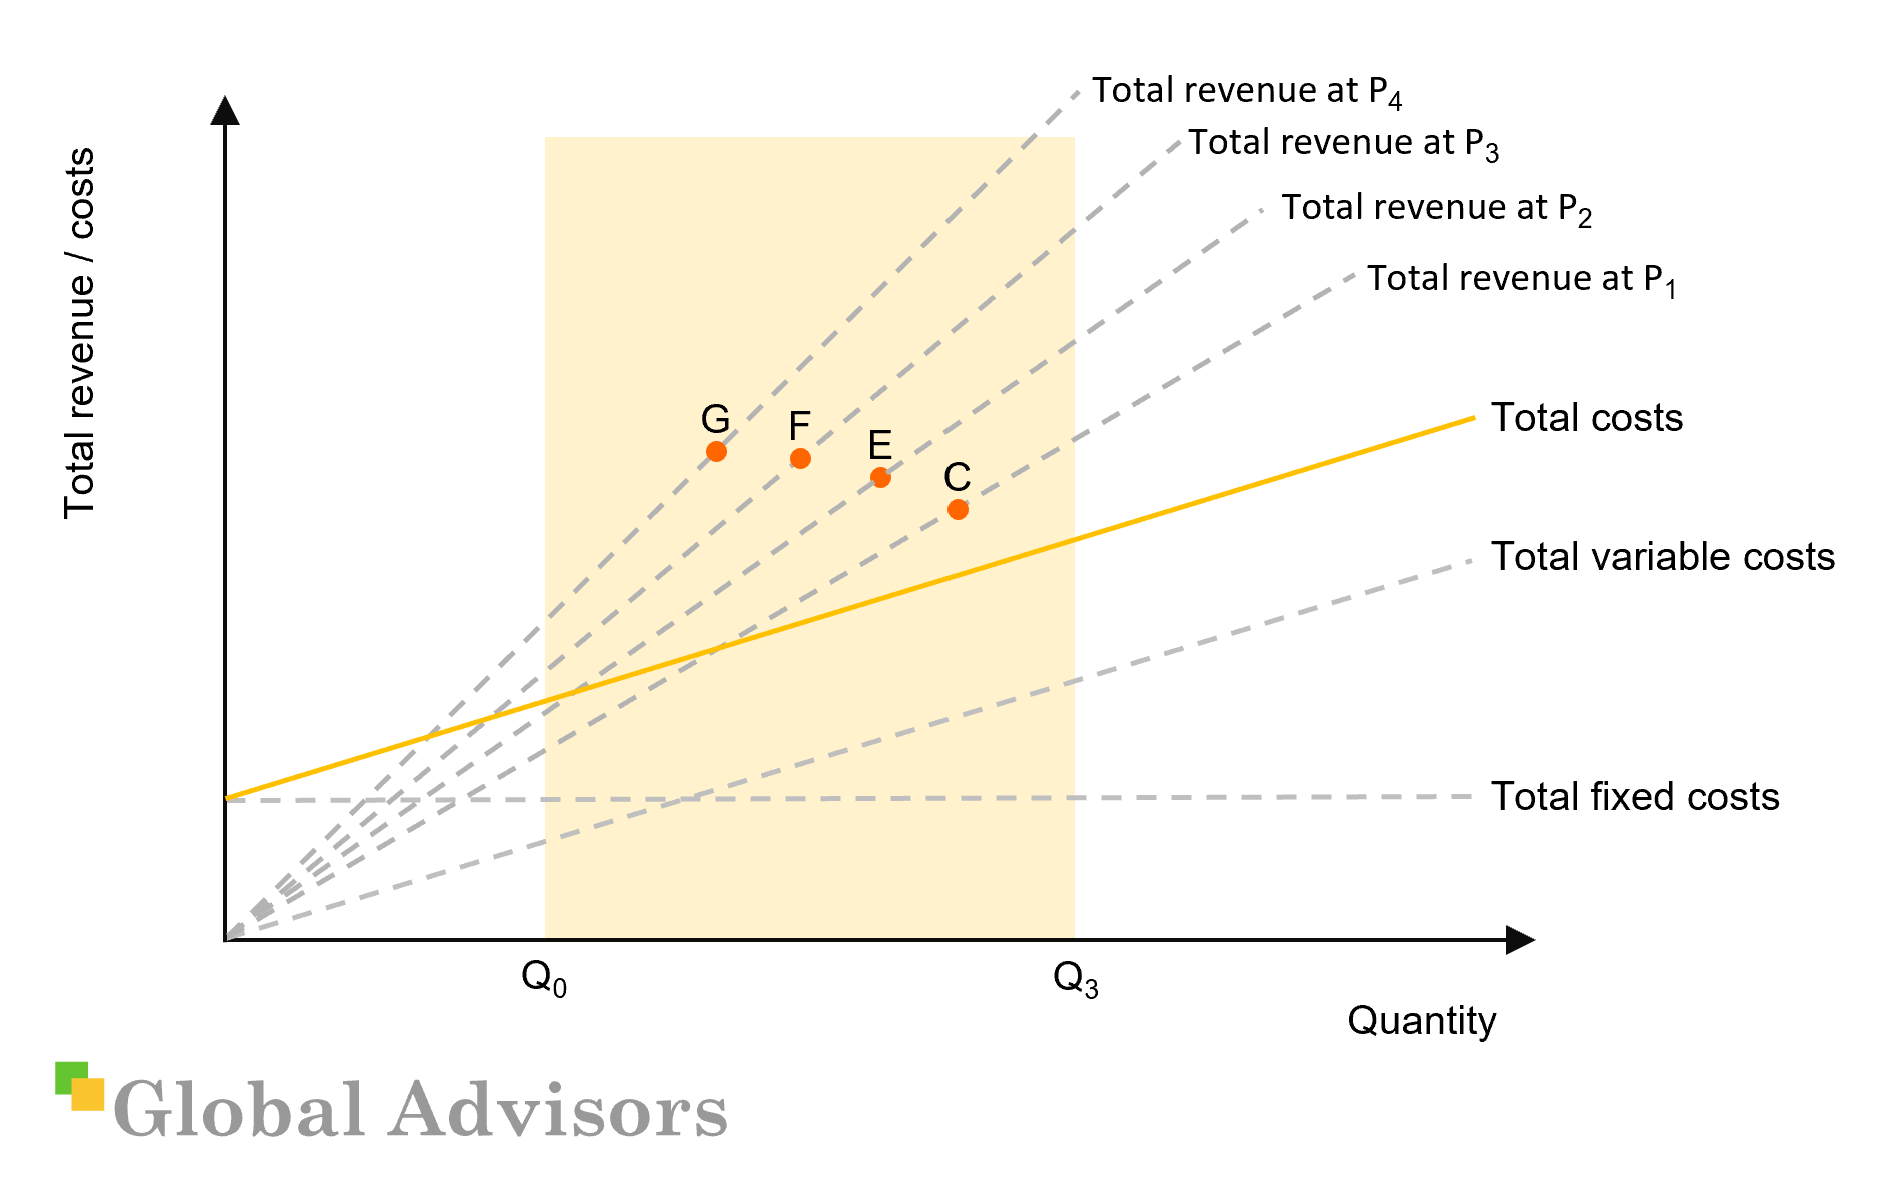
An even greater level of sophistication might account for the changes in price elasticity at different price levels. In theory, such an arc of price and volume combinations would be described by the demand curve on a corresponding price versus volume plot. The reality is that only some of the points on such a demand curve are evident through the various price-volume combinations achieved by the firm. Our critical emphasis is that regardless of the lack of knowledge of the complete demand curve, firms must account for volume changes in response to price changes.
In part 3 of this series on Price-Volume-Profit, we will show the derivation of the profit curve based on the interplay between CVP analysis and price elasticity.
CASE: Chasing profits through paying for volume
A commodity trader ('TradeCo') faced continued losses and volatile financial performance. Volume through its processing facilities varied with strong evidence of cyclical behaviour.
TradeCo owns processing facilities with minimum feasible size requirements, fixed quality and legal compliance costs and fixed electricity costs driven by refrigeration requirements. Large differences in peak and minimum demand result in poor utilisation of capacity at low points in the cycle.
TradeCo processed commodities with limited ability to differentiate. As a result, market participants largely competed through offering sellers better prices and attempted to achieve low cost positions through economies of scale. Buyers of the processed commodity were similar and switched regularly based on price.
Despite TradeCo's high proportion of variable costs, their fixed cost position was still high in absolute terms which resulted in pressure to achieve higher levels of utilisation. Limited levels of contracting in the market resulted in weekly pricing decisions based on intense competition in the market.
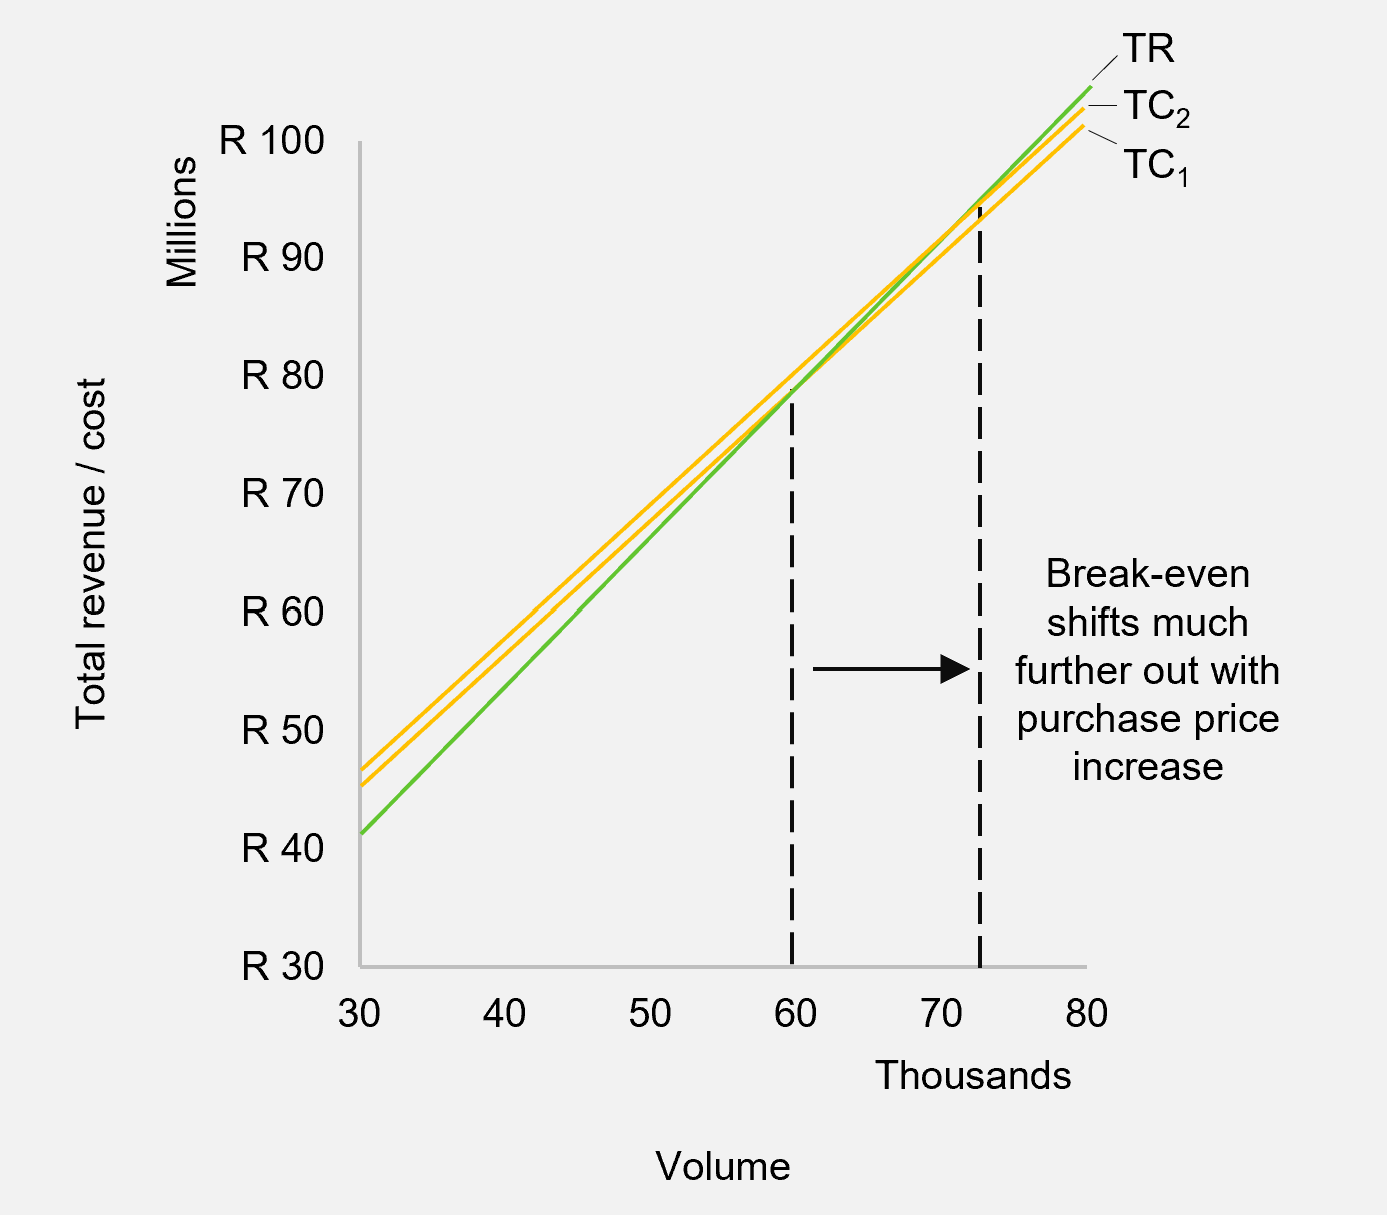
In an attempt to fill its plants and reduce the impact of damagingly low cyclical volumes, TradeCo offered suppliers slightly higher prices – or set a price against which competitors would react. As TradeCo increased volumes towards higher levels of utilisation, losses worsened substantially.
CVP analysis revealed exceptionally narrow 'jaws' between the total revenue and cost curves. Increasing purchase prices to secure volume dramatically narrowed these jaws further, shifting the breakeven point out to a position close to capacity. TradeCo also found that operating at high volumes resulted in achieving lower prices as it was forced to offload volume in the market. This pivoted the revenue curve downward, amplifying the effect.
TradeCo's CVP position with an upward swivel of the total cost curve due to higher purchase prices
TradeCo returned to profitability at lower levels of utilisation through fixed cost reduction and a renewed focus on purchase and selling price discipline.
The CVP crisis
We find that the use of CVP analysis is broken in many organisations. We typically see the following problems:
- Firms target a percentage profit margin and raise price – without accounting for volume reductions – in attempts to achieve this. They therefore expect to merely pivot the revenue curve, maintain volume and therefore increase profits.
- Costing allocations (which feed into CVP analysis) are inaccurate. The consequent view of product profitability may be inaccurate relative to competitors resulting in poor strategic, contractual and pricing decisions.
- Depreciation and utilisation of newer plants penalises businesses relative to peers with established capacity as products are evaluated on short run positions rather than target levels of production. It is critical to understand the difference between a CVP based on cash versus accounting figures.
- Firms may attempt to target increased volumes to raise plant utilisation through unsustainable behaviour such as continuous deep discounting.
- Firms may rationalise products based on inaccurate CVPs resulting in stranded costs or reallocations which in turn impact the profitability of other products.
It is our experience that combinations and repeated rounds of the above behaviours can result in 'death spirals'. We will return to this later.
How do managers explain attempting to bank increased profits by increasing prices without volume losses? They suggest they will mitigate volume losses through non-price factors. If that volume was available before a price increase, these managers should be questioned on why they did not achieve it then. The reality is that many managers budget price increases with stable volumes to satisfy planning pressure.
The CVP imperative
Given the interplay between variables that CVP analysis represents, a strategic ideal is for managers to operate in real time with a sophisticated view of their business (i.e. Profit = Quantity times (Price less Variable Cost per unit) less Fixed Costs).
This enables an understanding of the profitability of every transaction as it happens and allows for insight, effective management and competitive flexibility.
Great leaders and managers use this understanding to ask strategic questions:
- How can I increase volume through non-price factors, shifting along my existing revenue curve to increase profitability (e.g. through better distribution or availability)?
- How does my view of profitability change based on a change in my cost accounting and allocations?
- Over what range does my CVP relationship hold and where are the breakpoints in variable costs, fixed costs and capacity requirements?
- To what extent does my business benefit from economies of scale and scope and how are these reflected in my CVP analysis? This might be reflected in short relevant ranges or require the slope of the CVP curves to change with volume.
- How sensitive is my profit to relative percentage changes in variable cost per unit, fixed costs, volume, etc.?
- How might I change my business mix to alter the positions of the revenue and cost curves (e.g. loyalty and bundled pricing, by-product and co-product cost absorption, etc.)?
- What is the trend in the relative positions of the revenue and cost curves and what is driving this?
- How does the way I run my business affect the positions and relationships of the revenue and cost curves (e.g. incentives, contracts, sourcing, etc.)?
The answers to these types of questions can yield fundamental insights regarding a business and the market it is in. For example, a business with a high sensitivity to fixed costs relative to variable costs and output might reflect a commoditised business where large output volumes are required to be successful.
Pragmatic use of CVP analysis
Given the complexities of arriving at an accurate CVP, how should you start?
While it has its complexities, a useful starting approach is the regression of revenues and costs against volumes. If this were done for a multi-product company as a whole, such a CVP would represent the aggregate of all product volume effects for the company. Such aggregates can be misleading, but do represent a place to start.
Once such a regression is performed, the regression statistics can be examined for goodness of fit and the process of unpacking aggregates can begin. As the underlying data is improved, so should the goodness of fit.
An example of CVP analysis for one of our clients derived from regression of monthly revenue and costs
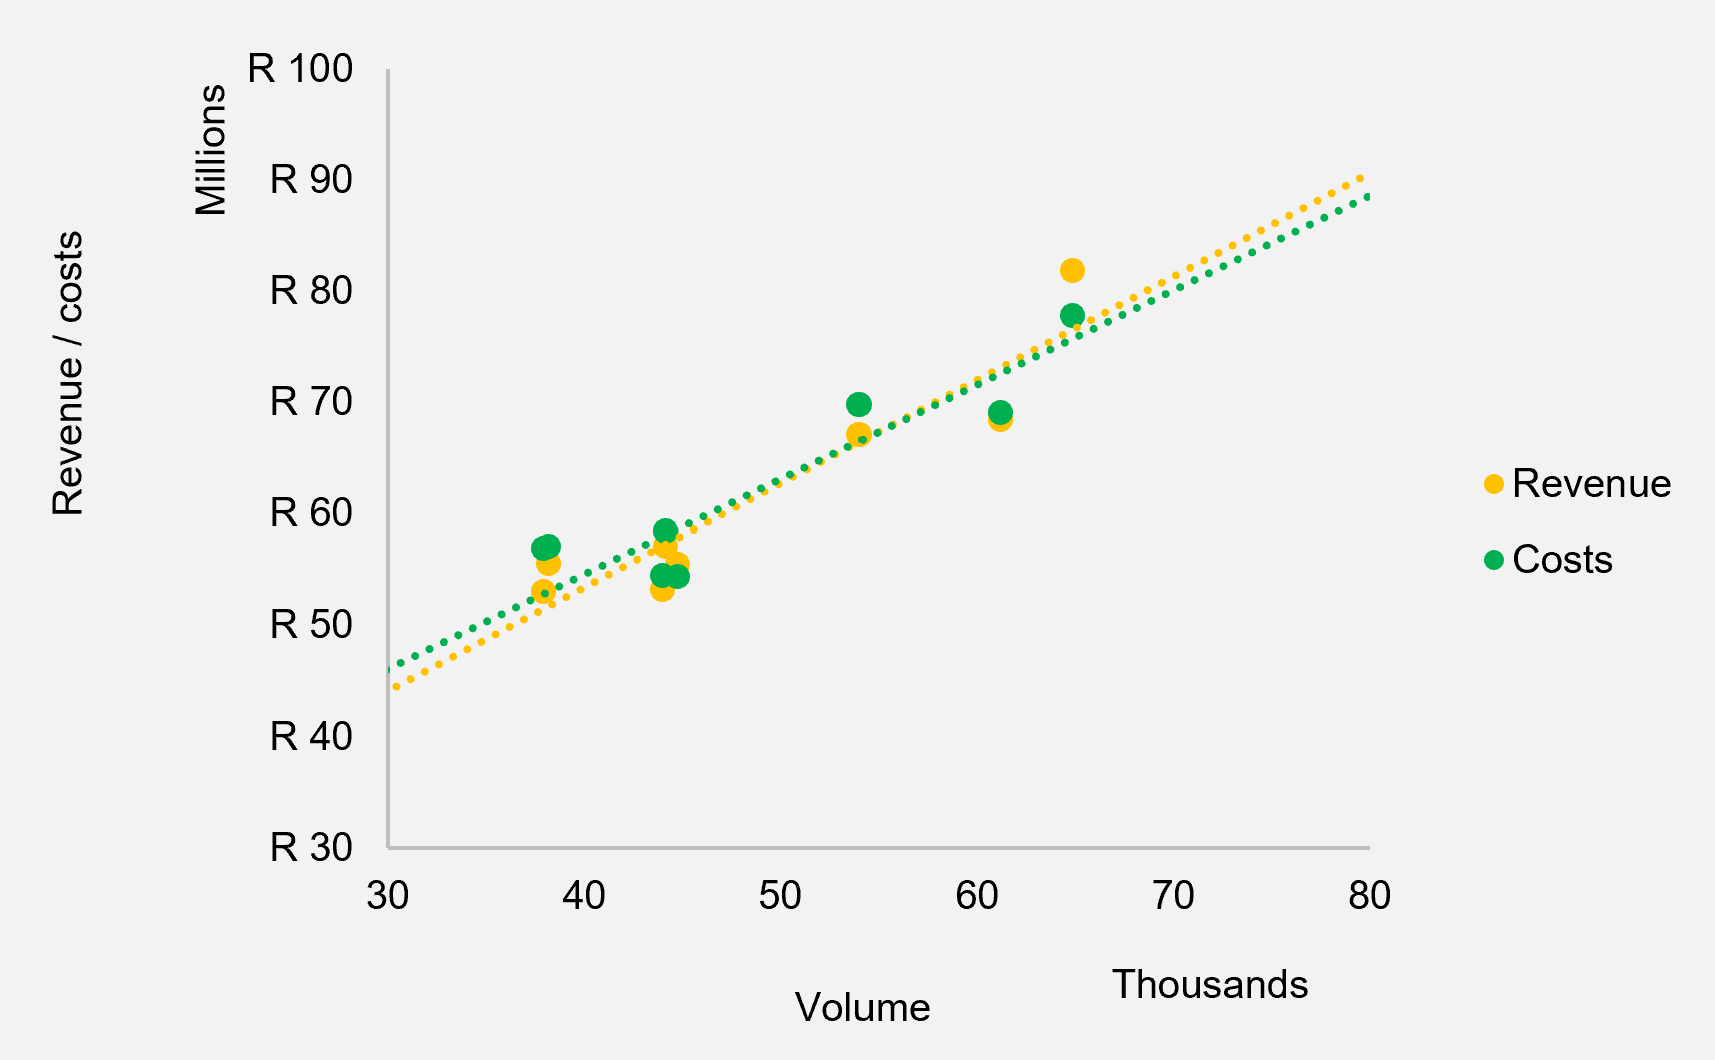
The usefulness of a regression approach such as the above is that the very process of understanding goodness of fit results can lead to insights into the underlying business. Attempts to improve regression results may result in the disaggregation of a CVP into multiple CVPs leading to a better understanding and management of the business.
Truly artful use of CVP analysis begins when an organisation starts to tailor its use to incorporate economic and strategic concepts. For example, a firm might incorporate fixed-asset cost of capital in its fixed costs and working capital cost of capital in its variable costs. This allows an approximation of economic profit from the analysis and can dramatically alter the answers to the questions above. In our experience, very few firms come close to this level of sophistication. Why?
Factors mitigating the accurate and effective use of CVP analysis
Fundamentally, CVP analysis relies on accurate costing. Any experienced manager will agree that costing is a mix of science and art – and that many businesses fail at even the science part.
To improve usefulness, CVP analysis should be represented at a product SKU level. This requires the accurate apportionment of fixed and variable costs to a SKU. Most businesses battle to apportion shared costs to product SKUs – if they even attempt to – and often might do so on the basis of revenue, costs or volume. Such apportionment hinders the chance of accurate CVP analysis as fixed costs take on the appearance of variable costs.
Decision-making based on CVP analysis can be further skewed by allocated fixed costs. A product might be considered uneconomic and scrapped resulting in allocation of its stranded fixed costs to other products – making them illogically less profitable.
The flip side of the above problem is that products with shared costs might be evaluated merely on their specific contributions, resulting in any product making a contribution being deemed as worthwhile. As a result, fixed and shared costs are never attacked and are seen a 'cost of doing business'.
A firm's choice and implementation of standard, activity-based and full-absorption costing can thus have dramatic impacts on the outcomes of analysis – particularly when supporting product and business evaluations. Firms may use such models to allocate fixed and variable costs in a way that alters decision making.
If depreciation and costs of capital are incorporated into CVP analysis, then the accounting methodology for this can have a pronounced effect – for example, the use of historic versus replacement cost depreciation.
Averaging can also be potentially harmful to useful CVP analysis. Customers, products, contracts, inputs and production processes are seldom that similar to allow for useful averages. In fact, it is the differences in these that often yield the most useful insights. In addition, small differences at unit levels can magnify substantially when multiplied through by large volumes.
CVP analysis is further complicated where unit cost and pricing are not linear over any significant range. This can require incorporation of multiple complicated breakpoints which can be fundamentally altered by contracts, labour shift decisions, machinery bottlenecks, etc.
CASE: The potential for a fast food death spiral
A manufacturer of fast food products ('FastCo') experienced declining profitability which put them at risk of entering a profit death spiral.
FastCo is the market leader in the manufacture and sale of a popular category of fast food products which are widely available. However, despite having the strongest brand, FastCo faced strong competition from both within their existing product category and from adjacent substitute categories. This placed pressure on profitability which threatened to act as a trigger for the death spiral as management were keen to take a price increase to improve margin and restore profitability.
However, CVP analysis showed that their current position was one where a price increase would harm profitability even more. This was based on the fact that, given market analysis and a reasonable understanding of price elasticity at current volumes, the modelled volume losses from a price increase would outweigh the margin benefit of increasing price.
FastCo's CVP analysis shows that increasing price would lessen profitability
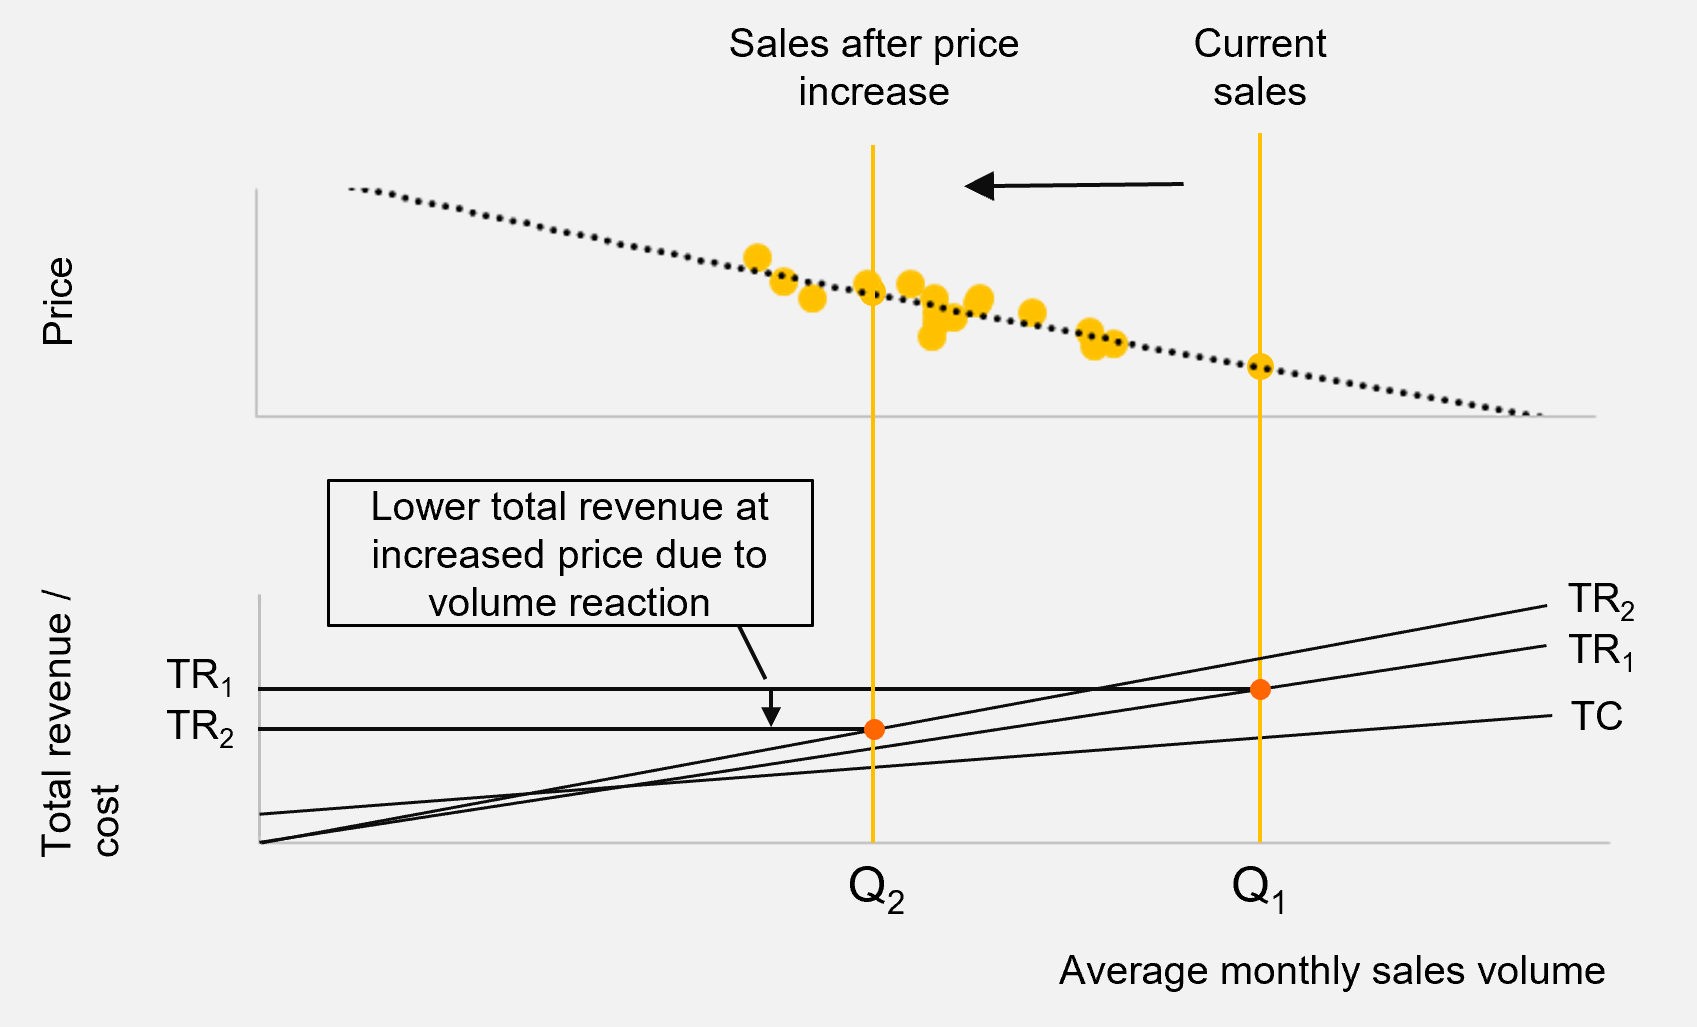
Note: the price / volume plot above is not fully representative of FastCo's demand curve (i.e. they are not necessarily on the inelastic (lower) portion of the demand curve)
The solution was for FastCo to move away from death-spiral-inducing price increases while focusing on addressing the pressing market concerns which were driving industry and company profitability at the time. By working on volume drivers like product innovation and increasing their market coverage through price-pack architecture, FastCo would be better equipped to deal with the growing competition.
While price is often a key lever driving competition, it's imperative for managers to have a balanced view of all available levers and, critically, to use each of them at an appropriate time. Price is not always the answer, as an astute CVP analysis can demonstrate.
The 'margin-price-volume death spiral'
Sadly, it has been a common experience to see clients enter what one practitioner termed the 'margin-price-volume death spiral'. The spiral begins as managers attempt to improve margin by increasing price without accounting for volume losses. As the price increases, customers buy less. The increase in percentage margin is outweighed by a larger percentage decrease in volume which lowers aggregate contribution. Worsening profitability results in managers taking further price increases, resulting in the spiral effect.
We have found the following critical contributors to the death spiral effect:
- Attempting to achieve a target EBIT or EBITDA margin by raising price: EBIT and EBITDA are aggregate profitability measures and calculating these at product unit level implies a fixed cost allocation which is dependent on current volumes or an assumed volume. Volume decreases for the price increase are either not taken into account or are underappreciated.
- Uncompetitive cost positions: firms may increase price in an attempt to reach benchmark profitability – rather than attack higher-than-benchmark fixed or variable costs.
- Uncompetitive operations / business models: Firms may have a sub-optimal ratio of fixed to variable costs. This might be driven by under- or over-investment, lack of flexibility, etc.
- Full-absorption costing: a business may implement full-absorption costing on lower-than-optimal or benchmark utilisation. Costs are higher than competitors as they are loaded with unutilised capacity. As a result, managers attempt to improve margins through increasing price.
- Vanity: businesses with strong strategic positions typically show healthy gross margins. Some managers attempt to create these margins by increasing price. Their folly is revealed when volume losses show their strategic positions to be unsupportive of these price increases.
The antidotes to the above are:
- Reaching full potential volume through non-price factors: availability, penetration, etc.
- Satisfying demand via optimal price-pack architecture: this helps optimise volumes at optimal prices.
- Proper understanding of the market and the product's price elasticity: understand the price-volume path as the revenue curve pivots.
- Accurate costing: accurate disaggregation of absorption costing into true variable costs per unit and fixed costs.
- Understanding appropriate benchmark targets and focusing on returns before margin: benchmark margins and returns differ by product and market. Returns should incorporate asset intensity, margins and volumes – sanity rather than vanity.
Conclusion
CVP analysis represents an approximate model of a company's economics – typically for a single product. It can be relied on only if data is accurate and for a limited relevant range under which fixed and variable cost relationships remain accurate and fairly linear. Movements in volume for pivots in the revenue curve based on price require careful modelling of elasticity and a keen understanding of the product's competitive position. Given these constraints, is CVP modelling useful and reliable?
It is our view that understanding your company's CVP position is essential in the absence of a better alternative. Better alternatives are often just more accurate CVP analyses (non-linear, incorporating breakpoints, etc.) and managing a business without a proper understanding of its economics is guesswork.
Accurate CVP analysis is a critical foundation for pricing decisions. While price and volume can be modelled without CVP analysis (part 2 of this series), it is only through linking these analyses that a firm can make an optimal decision – understanding whether the economic benefits of greater margin outweigh the volume losses resulting from a price increase (part 3 of this series). Should this be the case, then a further evaluation of the impact of market share losses on a firm's strategic position should be evaluated. Finally, a firm should assess mitigating tactics such as the use of price-pack-architecture changes and price-ladder coordination to offer customers continued choice and to optimise the impact of volume changes across a product range.
Strategic use of CVP analysis comes through the questioning of the basis for the relationships it shows and how to change these. This can lead to examining opportunities for automation, outsourcing, etc. These choices can lead to entire business model re-evaluation.
Ultimately, if profitability is a critical long-run objective for delivering shareholder value, the strategic interplay between price, volume and profit should be a strategic imperative. The importance of questioning the 'why' of each strategic pricing and costing decision cannot be underestimated. CVP analysis provides us with a starting point in quantifying such decision-making while still allowing us to view the product or business as a whole – and that's powerful.
Sign up to our email newsletters to receive Strategy Tools and other newsletters. Ensure you don't miss an update: go to http://www.globaladvisors.biz/newsletters to sign up.
Assumptions underlying CVP analysis
- We are contemplating and optimizing in the short-run; assuming long-run production decisions have already been made
This is the guiding assumption behind CVP analysis and means we've already made larger-scale production and investment decisions like what plant capacity to invest in. We are concerned with how to optimize profitability within this constraint which means some inputs into the CVP optimization problem are fixed (i.e. fixed costs relating to capacity generation). - All variables other than the one we're varying remain constant for a given scenario
If other variables change significantly, multiple CVP analyses should be prepared with these variations to ensure the effect of the changing variable is isolated. - We're dealing with a single product or constant sales mix if there's more than one product and the range of products produced is captured in existing fixed costs
This means keeping the ratio of products sold the same for the frame of the analysis and it allows us to make fair assumptions about the average selling price and cost per unit which would not be possible if our sales mix was changing at different levels of output. - We're operating within a relevant range of output
This critical assumption means we are confident about the cost and revenue estimates calculated within the studied range of output and that the behaviour of certain costs can be accurately understood within this range. - Costs can be appropriately allocated between fixed and variable components
Correctly allocating costs can be challenging but the assumption is that for the relevant range of output this can be done accurately and that more complex costs (e.g. semi-variable) can be allocated into approximate fixed and variable components.
In a foundational paper discussing the differences between the economist's and the accountant's approach to CVP analysis and the assumptions underpinning each, Bell (1969) provides evidence for how both the economist's way of thinking of total revenue (curvilinear) and the accountant's way (typically linear) are both relevant and capable of generating insight. For example, on the topic of linear versus curved total revenue curves, Bell states that 'Perhaps the curvilinear TR line of the economist could be explained being made up of a series of the short-linear sections drawn by the accountant.' We find that understanding both an accountant's and an economist's view of the components of CVP analysis is useful and relevant in accounting for uncertainty and interrogating the assumptions underlying a given business.
Sources
Bell, A.L – 'Break-even charts versus marginal graphs' – Management Accounting (USA), February 32 – 35 – 1969
Drury, C. – 'Management and Cost Accounting' – 3rd edition – 1992 – London: Chapman & Hall
Dow, A.S., Johnson, O. – 'The Break-Even Point Concept: Its Development and Expanding Applications' – Management Accounting (USA), February 29 – 31 – 1969
Gilchrist, D., Sands, E.G. – 'How to Get the Price Right' – https://medium.com/teconomics-blog/how-to-get-the-price-right-9fda84a33fe5 – accessed 21 October 2019
Weiser, H.J. – 'Break-even Analysis: A Re-evaluation' – Management Accounting (USA), February 36 – 41 – 1969
