| |
|

| |
| |
| |
|
A daily bite-size selection of top business content. |
| |
| |
| |
Term: Kurtosis - Statistics"Kurtosis is a statistical measure that quantifies the 'tailedness' of a probability distribution to indicate how frequently extreme outliers occur in a dataset. Instead of describing the peak's sharpness, it focuses on the data's tails relative to a normal distribution, which has an excess kurtosis of zero (mesokurtic)." - Kurtosis - Statistics Risk, reliability and model validity often hinge on how frequently a system produces extreme outcomes, not on how it behaves near its average case. In empirical work, the central challenge is to distinguish datasets where extremes are rare from those where apparently stable behaviour hides occasional but devastating shocks. This distinction drives decisions in financial risk management, engineering safety margins, climate science and social policy design, because standard summary statistics like the mean and variance do not tell us whether volatility is generated by many moderate deviations or by a few very large ones. From a practical standpoint, analysts care about tail behaviour because extreme observations can dominate totals, losses or system performance. Two datasets with identical means and variances may imply very different operational or financial risks if one produces rare, enormous values while the other fluctuates only moderately. For example, a portfolio return series with occasional crashes and bubbles can share the same variance as a more benign series in which gains and losses are small but frequent. Likewise, in quality control, a process with rare catastrophic failures demands different intervention from one with frequent minor deviations, even if standard deviation is similar. Tail-sensitive metrics are therefore central to stress testing, outlier detection and the design of robust statistical procedures. Substantive meaning: tailedness rather than peak shape The conventional textbook description links kurtosis to how sharply peaked a distribution appears, but this is largely a historical artefact of early moment-based shape descriptions. Modern statistical writing emphasises that kurtosis is fundamentally about tailedness, meaning the proportion of total variation attributable to infrequent extreme deviations compared with frequent moderate ones. High kurtosis indicates that more of the variance comes from observations far from the mean, while low kurtosis indicates that values are concentrated nearer the centre, with tails that die off relatively quickly. This tail-focused view resolves a common confusion: two very different distributions can exhibit similar central peaks, yet differ drastically in how often they generate outliers, and it is this latter aspect that kurtosis quantifies in a systematic way. Because kurtosis is defined via a normalisation by variance, it is sensitive to the relative rather than absolute contribution of extremes. A distribution with heavy tails but enormous variance may not have exceptionally high kurtosis because moderate deviations contribute substantially to the variance alongside extremes. Conversely, a distribution where variance is driven almost entirely by rare extreme events will show high kurtosis, even if its central peak is visually unremarkable. This variance-relative perspective explains why visual impressions based solely on peak sharpness can be misleading, and why histogram inspection should be supplemented with quantitative measures when tail risk matters. Formal specification and parameter interpretation The standard mathematical definition treats kurtosis as the fourth moment of a standardised variable. Let be a real-valued random variable with mean and standard deviation . The population kurtosis is defined as the expected value of the fourth power of the standard score: . This formulation highlights two features. First, the centralising by focuses attention on deviations from the mean. Secondly, the scaling by renders the measure dimensionless, so kurtosis compares the fourth moment to the second moment in a unified framework. The fourth power amplifies large deviations disproportionately compared with modest ones, making highly sensitive to extreme values. While the second moment, or variance , weighs squared deviations , kurtosis effectively examines , thereby magnifying tail contributions and diminishing the relative influence of observations close to the mean. For a normal distribution, one can show that , and this value is often used as a baseline for comparison. The difference between observed kurtosis and 3 is called excess kurtosis, , which sets the normal distribution at zero and allows direct interpretation as tail heaviness relative to normal behaviour. In applied statistics, sample kurtosis must be estimated from finite data, and naive estimators are biased, especially in small samples. Software implementations typically adjust the fourth-moment-based statistic by functions of the sample size to yield an approximately unbiased estimate of excess kurtosis. A typical sample formula uses the standardised fourth moment scaled by and then subtracts 3, together with further corrections so that, under normality, the expected value of the estimator is zero. These adjustments matter because kurtosis is particularly sensitive to sampling variability: a single outlier can dramatically inflate the statistic in small datasets, and proper inferential use requires attention to standard errors and sampling distributions. Types of kurtosis and their practical meaning Interpretation is usually framed in terms of three qualitative categories. Mesokurtic distributions have excess kurtosis close to zero; they behave similarly to the normal distribution in terms of tail frequencies and outlier occurrence. Leptokurtic distributions have positive excess kurtosis, indicating heavier tails: they generate extreme values more frequently than a normal distribution with the same variance. Platykurtic distributions, with negative excess kurtosis, have lighter tails and produce fewer outliers than would be expected under normality. These labels, while descriptive, are less important than the underlying tail probabilities: in risk-sensitive applications, the magnitude of excess kurtosis offers a quantitative signal of how far empirical behaviour deviates from Gaussian assumptions. Concrete consequences differ across domains. In finance, leptokurtic return distributions imply that models based on normality severely underestimate the frequency of crashes and rallies, calling for heavy-tailed models such as -distributions or jump-diffusion processes whose kurtosis exceeds 3. In psychometrics or educational assessment, positive excess kurtosis in test scores can signal the presence of students with extraordinarily high or low performance, prompting reconsideration of scaling, item difficulty or support interventions. In reliability engineering, high kurtosis in failure times suggests that systems usually perform reliably but occasionally fail catastrophically, which may justify stricter safety standards or redundancy design. Conversely, platykurtic behaviour may be acceptable where minor fluctuations are tolerable and extremes are structurally unlikely. Relationship to skewness and distribution shape Skewness and kurtosis both describe distribution shape, but they capture different dimensions. Skewness measures asymmetry around the mean, indicating whether the distribution has a longer or heavier tail on one side than the other. Kurtosis, by contrast, ignores directional asymmetry and instead measures the overall contribution of tails to variability, aggregating extreme behaviour on both sides of the mean. A distribution can be symmetric yet highly leptokurtic, such as a symmetric heavy-tailed law, or it can be skewed but platykurtic, if tails are asymmetric but overall outlier frequency remains low. Mathematically, there is a constraint linking full kurtosis and skewness : , implying that excess kurtosis cannot be less than . This bound reflects the fact that even strongly skewed distributions cannot have arbitrarily thin tails. In exploratory data analysis, reporting both skewness and kurtosis alongside mean and variance provides a richer summary of shape, helping distinguish different modes of deviation from normality. A dataset with near-zero skewness but high positive excess kurtosis suggests symmetric tails with elevated outlier risk, while one with large skewness but modest excess kurtosis points to directional bias without extreme values. Such distinctions guide model choice, for instance whether to prioritise robust location estimators, transform the data, or adopt heavy-tailed error structures in regression or time-series models. Debates, limitations and ongoing relevance Despite its widespread use, kurtosis is not without controversy. Critics note that because kurtosis is highly sensitive to single extreme observations, it can behave erratically in small samples and does not always map cleanly onto visually intuitive notions of tail heaviness. Others argue that interpreting kurtosis as a measure of peak height is misleading and detracts from its more precise meaning relating to tail contributions to variance. There is also conceptual debate about whether moment-based measures are the best tools for describing tail risk, or whether alternative metrics such as quantile-based measures, tail indexes from extreme value theory or empirical exceedance probabilities are more informative for decision-making. Nonetheless, kurtosis remains a central tool in descriptive statistics and model diagnostics. Many formal normality tests incorporate skewness and kurtosis, and practitioners routinely use these statistics to flag deviations from Gaussian assumptions before applying standard parametric methods. In data science pipelines, automated quality checks often include kurtosis thresholds to identify problematic variables with extreme outliers or unusual tail behaviour, prompting transformations, winsorisation or robust methods. In research contexts, reporting kurtosis helps readers assess whether standard error estimates, confidence intervals or hypothesis tests predicated on normality might be unreliable. As data volumes grow and systems become more interconnected, the practical importance of understanding how often and how severely extreme events occur has only increased, ensuring that kurtosis, carefully interpreted as a measure of tailedness and outlier propensity, remains an indispensable concept in statistics and applied analytics.
|
| |
| |
Global Advisors News Brief - July 18 2026Read the full brief at the link Headlines for the last 24hrs
Time window: 2026-07-17T05:00:33.068Z to 2026-07-18T05:00:33.068Z |
| |
| |
Quote: Peter F. Drucker - Leadership and management thinker"The most important thing in communication is to hear what isn't being said." - Peter F. Drucker - Leadership and management thinker Communication fails most often at the point where language becomes too neat. The words at the surface may be accurate, yet the real problem sits underneath them in hesitation, omission, tone, timing, and the effort people make to avoid risk. In organisational life, that gap matters because employees rarely volunteer every concern, customers rarely state every objection, and teams often conceal disagreement behind politeness. The practical challenge is therefore not only to decode speech, but to detect the pressure, caution, and incentives shaping what is left out of it. Drucker's long-standing focus on management as a discipline of observation helps explain why this idea retains force. His work consistently treated organisations as human systems in which performance depends on judgement, not merely on procedures. That outlook fits a simple but uncomfortable reality: what people say in formal settings is often filtered by hierarchy, incentives, fear of embarrassment, or the desire to move a conversation along. Listening for absence means noticing when a subject is avoided, when enthusiasm sounds rehearsed, or when an apparently direct answer leaves the decisive issue untouched. The hidden layer in ordinary communication The underlying mechanism is not mystical intuition. It is pattern recognition. Effective listeners compare what is said with what would ordinarily be expected if the speaker were fully open. A delayed answer can suggest uncertainty. A carefully generic phrase can conceal a disagreement that has not been made safe enough to express. A change in rhythm can reveal that a question has landed on sensitive ground. These are not proofs on their own, but they are useful indicators that the official message is incomplete. This is why the idea resonates with experienced managers and negotiators. In a meeting, the important information may appear only in the pause before agreement, the side comment after the meeting, or the absence of follow-up on a promised action. In customer work, the real issue may not be the complaint articulated aloud, but the fact that the customer keeps returning to the same inconvenience without naming the deeper frustration. In employee relations, silence can signal disengagement long before performance metrics show trouble. The value of attentive listening is that it turns those weak signals into questions worth asking. Why people leave things unsaid What remains unsaid is rarely accidental. People omit information for strategic, social, or emotional reasons. They may want to protect themselves, avoid conflict, preserve status, or keep options open. They may also lack the language to name what they feel, especially where the subject is subtle or politically charged. In organisations, this is amplified by power asymmetry: junior staff often learn quickly that directness carries a cost, while senior figures sometimes receive more politeness than honesty. The result is a communicative environment in which the visible message is only partly reliable. That creates a difficult burden for leaders. If they rely only on explicit statements, they risk taking compliance for commitment and silence for consent. Yet if they become overly suspicious, they can start projecting hidden motives onto every pause and gesture. The discipline, then, is to listen without over-interpreting. Good listeners do not assume that every silence contains a secret; they use silence as a cue to ask a better question. Drucker's reputation for asking probing questions rather than demanding premature certainty matches that approach. The strategic value of hearing absence From a management perspective, this matters because organisations are full of signals that do not fit neatly into reports. Strategic problems are often visible first as hesitation rather than as data. A team that keeps postponing a decision may be revealing disagreement that nobody has formalised. A department that produces polished updates but little urgency may be signalling a deeper loss of belief in the plan. A sales conversation that sounds positive but yields no concrete next step may indicate polite resistance rather than genuine interest. Listening for what is missing helps leaders detect these gaps before they become expensive. There is also a broader market implication. In competitive environments, firms that hear only the stated demand may miss the latent demand. Customers often cannot articulate the real inconvenience they want removed, so they describe symptoms rather than causes. The most useful commercial insight may come from what customers keep circling around but never quite name. That is one reason the ability to infer the unspoken has such value in product design, service design, and client development. It is less about reading minds than about identifying the mismatch between surface language and underlying need. The objections and the risk of overreach There is a serious objection to this approach: it can become an excuse for projection. Once people are told to read between the lines, they may start treating their own assumptions as insight. That risk is especially high in leadership, where status can make private interpretation feel like objective truth. A manager may decide that a quiet employee is disengaged, when the employee is simply reflective or unfamiliar with the format. Another common error is to treat every hesitation as resistance, when it may instead reflect caution, respect, or the need for more information. The answer is not to abandon the search for the unspoken, but to make it testable. Skilled communicators use observation as a prompt for clarification. They ask a second question, invite disagreement, or create a setting in which people can speak without immediate penalty. In that sense, hearing what is unsaid is not an invitation to mind-reading. It is an invitation to better inquiry. The strongest leaders treat ambiguity as a signal to listen longer, not as a licence to fill in the blanks with convenient certainty. Why the insight still matters The enduring value of this idea is that it shifts communication from transmission to interpretation. Messages are never just packets of information moving cleanly from one person to another. They are shaped by fear, aspiration, institutional culture, and the social cost of candour. Once that is accepted, communication becomes less about forcing clarity and more about creating conditions in which truth can be spoken safely. That is why the ability to hear what is omitted matters so much in leadership, where trust is built as much by what people are allowed to say as by what they are instructed to say. It also explains why the best communicators often seem unusually calm. They are not rushing to answer every statement as if it were complete. They are watching for the edge of the sentence, the contradiction inside the tone, the uncertainty behind the summary. They understand that the decisive material in a conversation is often not the polished sentence, but the sentence that almost got said. In that sense, the deeper skill is not passive listening but disciplined attention, combined with the humility to assume that the first version of any message may be the least revealing one.
|
| |

| |
Term: Correlation coefficient - Statistics"A correlation coefficient is a statistical value between -1 and +1 that measures the strength and direction of a linear relationship between two variables. A value of +1 indicates a perfect positive relationship where both variables increase together, -1 indicates a perfect negative relationship where one increases as the other decreases, and 0 indicates no linear relationship at all." - Correlation coefficient - Statistics A correlation coefficient matters because it compresses a cloud of paired observations into a single signed measure of how closely they move together in a straight-line sense. In practical analysis, that makes it a fast diagnostic for pattern, but also a frequent source of overstatement when readers mistake association for causation or treat a linear summary as if it captured every kind of relationship . In standard statistical use, the coefficient is bounded between -1 and +1, with values near +1 indicating that higher values of one variable tend to accompany higher values of the other, values near -1 indicating that one tends to rise as the other falls, and values near 0 indicating little or no linear association . The important qualifier is linearity: a zero correlation does not mean two variables are unrelated in any general sense, only that there is no clear straight-line pattern in the data . What the measure captures The most widely used version is Pearson's correlation coefficient, usually written as for a sample or for a population parameter. It is defined as covariance scaled by the product of the variables' standard deviations, , which makes the result unit-free and therefore comparable across variables measured on different scales . That scaling also explains why the coefficient is sensitive to how spread out the variables are, not just to how they co-vary . Another useful way to express the sample version is , where and are paired observations and , are their means . This formula reveals the mechanism directly: the numerator rewards paired departures from the mean that move in the same direction, while the denominator rescales by the overall variability in each series . Because the coefficient is normalised, it does not change if a variable is converted from pounds to pence, or from metres to centimetres. What it does change with is the geometry of the data: outliers, skewed distributions, curved patterns, and clustered subgroups can all alter the value dramatically even when the underlying relationship looks strong by eye . How to read the value The sign tells you direction; the absolute value tells you strength. A large positive value means the two variables tend to move together, a large negative value means they tend to move in opposite directions, and a value close to zero means the points do not lie near a straight line even if some other pattern is present . In policy work, business analytics, and scientific reporting, this distinction matters because a weak correlation can hide a strong non-linear effect, while a strong correlation can still be useless for prediction if the data are unstable or distorted by outliers . There is also a common interpretive trap: people often read a coefficient such as 0,6 as if it meant 60% of one variable is explained by the other. That is not what the coefficient itself means. The square of the Pearson correlation, , is the proportion of variance linearly shared in the simplest bivariate setting, but even that should not be treated as proof of mechanism or causation . The coefficient is therefore best understood as a summary of pattern, not a verdict. It tells you whether a linear trend is present and roughly how tight the point cloud is around that trend, but it does not tell you why the pattern exists, whether the association is spurious, or whether the relationship will persist outside the sample . Pearson, Spearman, and the choice of method Major schools of thought differ mainly on what kind of relationship deserves to be summarised. Pearson's is the default for continuous variables when the relationship is approximately linear and there are no extreme outliers . Spearman's rank correlation, written or sometimes , replaces raw values with ranks and is therefore better suited to ordinal data, non-normal distributions, monotonic but curved relationships, and settings where outliers would dominate a Pearson calculation . The Spearman coefficient can be expressed as when there are no tied ranks, where is the difference between the paired ranks and is the number of observations . The practical implication is that Spearman asks a different question: do the variables move in the same order, even if they do so non-linearly? Pearson asks whether the relationship is close to a straight line . That difference is why analysts often compute both. A pronounced Pearson coefficient with a weak Spearman coefficient can indicate a threshold effect or some other non-linear structure, while the reverse can suggest a monotonic association that is not linear enough for Pearson to capture cleanly . In applied work, using both can be more informative than searching for a single definitive number . Why correlation is not causation One of the longest-running debates around the coefficient concerns interpretation under causal uncertainty. Correlation alone cannot distinguish between direct causation, reverse causation, confounding, or coincidence . Two variables may correlate because they are both driven by a third factor, because one affects the other, or because the sample is too small or too selective to reveal the true structure . This is why correlation analysis is usually paired with scatterplots, substantive domain knowledge, and, where possible, regression or experimental design. A scatterplot shows whether the coefficient is summarising a roughly linear cloud, hiding a curve, or being driven by a few influential observations . Regression then extends the analysis by estimating a line and associated parameters, whereas correlation stays focused on the strength and direction of association . There is also a technical limitation that is easy to forget: correlation is a symmetric measure. The correlation between and is the same as the correlation between and , so it does not encode direction of prediction or mechanism . That symmetry is statistically elegant, but it makes the coefficient unsuitable as a stand-alone model of influence . Why the term still matters The correlation coefficient remains one of the first statistics taught because it is compact, intuitive, and surprisingly deep. It links geometry, probability, and data analysis: as the point cloud tightens around an upward-sloping line, the coefficient rises towards +1; as it tightens around a downward-sloping line, it falls towards -1; and as the cloud loses any straight-line structure, it moves towards 0 . That simple scale makes it a useful common language across economics, medicine, psychology, engineering, and market research . It also matters because many downstream tasks depend on it. Feature screening, portfolio construction, assay validation, psychometric checking, and quality control often begin with correlation because it offers a quick way to detect redundancy, instability, or unexpected coupling between variables . Even when the number itself is not the final answer, it is frequently the first signal that an analyst should ask better questions. The strongest analytical habit is therefore not to worship the coefficient, but to place it inside a broader workflow. Read the sign, inspect the scatter, test the assumptions, compare Pearson with Spearman where relevant, and remember that the value is a summary of association rather than a substitute for explanation . Used that way, the correlation coefficient remains one of the most efficient tools in statistics: modest in appearance, but central to disciplined interpretation .
|
| |
| |
Global Advisors News Brief - July 17 2026Read the full brief at the link Headlines for the last 24hrs
Time window: 2026-07-16T05:00:33.066Z to 2026-07-17T05:00:33.066Z |
| |
| |
Quote: Demis Hassabis - Google Deepmind CEO"The magnitude of this technology's impact will be unprecedented, perhaps 10x of the Industrial Revolution at 10x the speed. It will help us solve some of the biggest problems society faces from accelerating drug discovery to developing new clean energy sources to creating novel advanced materials." - Demis Hassabis - Google Deepmind CEO Forecasts of technological impact often hide a deeper anxiety: how much disruption can societies absorb before their institutions, economies, and moral frameworks buckle under the strain. Demis Hassabis situates frontier artificial intelligence in this danger zone, arguing that we face not another incremental wave of automation but a compression of multiple industrial-scale upheavals into a single decade, driven by systems that increasingly operate as active problem-solvers rather than static tools. His claim rests on two interlocking ideas: that artificial general intelligence will be a general-purpose technology touching almost every sector at once, and that the feedback loop between AI research, computing infrastructure, and real-world deployment will drastically shorten the time between scientific discovery and mass adoption. From Mechanising Muscle To Mechanising Mind The historical comparison to the Industrial Revolution is not chosen for rhetorical flourish; it signals a shift from mechanising physical labour to mechanising cognitive labour. Steam engines, electricity, and assembly lines reconfigured production by amplifying human and mechanical muscle, raising output and lowering unit costs across manufacturing, transport, and communication. Artificial intelligence instead targets tasks historically reserved for human judgement and pattern recognition: drug design, legal reasoning, logistics optimisation, creative design, strategic planning. Where earlier revolutions replaced repetitive manual tasks, frontier AI threatens to reshape the structure of white-collar and scientific work by inserting algorithmic agents into the core of decision-making. The underlying tension is that many of society's most sensitive functions - medical diagnosis, financial risk allocation, security analysis - depend precisely on those cognitive capabilities now being replicated at scale. Economists frame such shifts using the language of general-purpose technologies, whose impact cascades through complementary innovations and organisational changes over decades. Steam and electricity followed that pattern: slow build-up, institutional resistance, gradual diffusion. Hassabis argues that frontier AI breaks this tempo constraint because algorithms can be instantly replicated once trained, and digital infrastructure is already global. Unlike railways or power grids, AI deployment does not require massive physical construction before benefits appear; once models reach a certain capability threshold, they can be embedded into cloud platforms, productivity tools, and scientific workflows with comparatively low marginal cost. The result is a plausible scenario in which sophisticated cognitive capabilities propagate across industries in 5 to 10 years rather than the 80 to 100 years associated with the first Industrial Revolution. Drug Discovery, Clean Energy, And Materials As Test Cases The most concrete part of Hassabis's vision is the claim that frontier AI will accelerate scientific problem-solving across domains that have resisted conventional research approaches: drug discovery, clean energy, and advanced materials. AlphaFold's success in protein structure prediction is already cited as evidence that machine learning can compress the search space of biological configurations, enabling researchers to focus laboratory effort on promising candidates rather than exploring blindly. In drug discovery, the combinatorial explosion of molecular possibilities has long been a bottleneck; AI systems able to propose, evaluate, and iteratively refine candidate molecules effectively become cognitive amplifiers for medicinal chemists, increasing hit rates and shortening timelines from hypothesis to clinical trial. Similar dynamics apply in energy research, where optimisation of battery chemistries, photovoltaic materials, and catalytic processes involves high-dimensional parameter spaces that are well suited to data-driven exploration. Advanced materials sit at the junction of physics, chemistry, and engineering, traditionally requiring years of trial-and-error experimentation. AI models that learn generative rules for material properties enable virtual screening of vast design spaces before any physical prototypes exist, reducing both cost and time to innovation. If such systems are paired with automation in laboratories, the loop from model suggestion to synthesis to testing becomes semi-autonomous, turning what were once decade-long research programmes into projects measured in single-digit years. The strategic implication is that states and firms able to align compute, data, and automation around these AI-augmented pipelines may pull dramatically ahead in pharmaceuticals, energy systems, and defence-related materials, reinforcing geopolitical and commercial asymmetries. Speed As Both Asset And Hazard The claim that AI could be 10 times faster than the Industrial Revolution is not purely about computational throughput; it is about recursive improvement. Hassabis has repeatedly highlighted the prospect of AI systems contributing directly to AI research, from code generation and architecture search to automated theorem proving in areas relevant to optimisation and learning theory. When models assist in designing their successors, even partially, the traditional separation between tool and researcher blurs. In such a regime, progress in underlying algorithms, hardware efficiency, and training strategies can be accelerated by the very systems being improved, introducing a form of soft recursive self-improvement that compounds existing productivity gains. This speed is strategically attractive for firms and nations racing to capture economic and military advantages, but it also narrows the window for governance. Institutions that struggled to regulate steam power, monopoly capital, and factory labour over 80 years now face a technology that may reshape employment, information ecosystems, and scientific practice in 5 to 10 years. Hassabis has warned that bad actors could weaponise powerful models for cyber attacks, biological threats, or disinformation, and that increasingly autonomous agents may pursue unintended strategies once embedded in complex environments. The faster capability advances, the more difficult it becomes to institute standards, monitor deployment, and align incentives before harmful uses scale. In that sense, speed functions simultaneously as competitive advantage and systemic risk multiplier. Economic Disruption And The Prospect Of Radical Abundance Economic analyses of AI adoption already show shifts reminiscent of earlier industrial upheavals, particularly in the distribution of income between labour and capital. Research on investment management suggests that large-scale use of AI and big data leads to declines in the labour share of income of around 5 percent, driven by data-intensive capital substituting for certain human tasks. Historically, the Industrial Revolution witnessed 5 to 15 percent declines in labour share, causing decades of social conflict before new institutions stabilised the system. Hassabis and other AI leaders frame advanced AI as a pathway to radical abundance, implying that once cognitive tasks are largely automated, goods and services could approach near-zero marginal cost. Yet the question of who owns the systems, data, and intellectual property that underpin this abundance remains unresolved. If frontier AI shifts value creation towards owners of compute infrastructure, foundational models, and proprietary datasets, the risk is an intensified Great Divergence, where a small number of jurisdictions and firms accumulate disproportionate gains while lagging economies see limited benefits. Hassabis has suggested that new economic models may be required to manage disruption 10 times larger than the Industrial Revolution, hinting at mechanisms such as universal basic capital, reskilling programmes, and revised competition policy. The debate is not simply about job loss; early evidence indicates AI can raise productivity and expand demand for certain types of human expertise. The strategic challenge is to design frameworks that translate aggregate productivity gains into broad-based improvements in living standards rather than capital concentration and social fragmentation. Debates, Objections, And The Limits Of Extrapolation Not all analysts accept forecasts of 10 times the impact at 10 times the speed. Historians of technology point out that general-purpose technologies typically encounter institutional frictions, cultural resistance, and infrastructural constraints that slow diffusion, regardless of their technical potential. They argue that comparing a still-maturing AI ecosystem to a fully realised century-long industrial transformation involves substantial extrapolation and ignores potential ceilings on learning curves, data quality, and compute affordability. Even within AI research, there is debate about whether current scaling trends can continue indefinitely or whether fundamental breakthroughs in areas like continual learning, memory, and long-term reasoning are necessary before the most dramatic visions can materialise. Critics also question whether impact should be measured purely in economic and technological metrics. The Industrial Revolution transformed patterns of urbanisation, family structure, and labour politics; AI may instead primarily alter epistemic environments, information authenticity, and human self-understanding. For example, pervasive reliance on generative models for communication and creativity raises concerns about homogenisation of culture and erosion of individual agency. Hassabis himself has warned that social media offers a cautionary tale of powerful technologies deployed without sufficient foresight, leading to polarisation and mental health harms. That history fuels scepticism about assurances that AI can be managed carefully enough to avoid similar or greater damage, particularly when competitive pressures drive rapid rollout. Why The Stakes Are Unusually High The reason Hassabis's prediction matters is not the exact multiplier attached to the Industrial Revolution but the structural claim that societies are moving into a regime where cognitive capability becomes a programmable resource, scaling almost as readily as software. If frontier AI does enable dramatic acceleration in domains like drug discovery, clean energy, and materials science, the upside is immense: faster cures, decarbonisation breakthroughs, and new infrastructure possibilities. Yet those same capabilities can destabilise labour markets, amplify geopolitical rivalries, and enable malign uses at a pace that challenges traditional governance mechanisms. The backstory behind the statement is thus a collision between technical optimism and institutional realism: a belief that scientific progress is about to speed up sharply, coupled with concern that our political, economic, and ethical systems have only a short window to adapt.
|
| |
| |
Term: Inflation - Economics"Inflation is the general and sustained increase in the prices of goods and services across an economy over time, which simultaneously reduces the purchasing power of money. When inflation occurs, each unit of currency buys a smaller percentage of a good or service, meaning that everyday expenses like food, housing, and fuel become more expensive." - Inflation - Economics Inflation matters because it changes the real value of money, not just the sticker price of goods. A rise in the general price level means households need more currency to buy the same basket of items, while firms face higher input costs and policymakers face a harder task in keeping growth, wages, and price stability aligned. Definition and economic meaning In standard economic usage, inflation is a sustained rise in the general level of prices across an economy, rather than a one-off jump in a single item. That distinction is crucial: a temporary increase in the price of bread, petrol, or rent does not by itself prove inflation, because inflation is about the average movement of many prices over time. The practical meaning is a decline in purchasing power, so each unit of currency buys a smaller share of goods and services than before. This is why inflation is best understood as a monetary and macroeconomic variable, not a household anecdote. A family may notice one item becoming more expensive, but economists look for broad, persistent changes in a basket of goods and services, often tracked by price indexes such as the Consumer Price Index, the Producer Price Index, and related measures. The annual inflation rate is usually reported as the percentage change in such an index over a year or other reference period. How inflation is measured The most familiar metric is the Consumer Price Index, which compares the cost of a representative basket of household purchases across time. If the basket costs at time and in the previous period, a simple inflation rate can be written as . That formula captures the change in the general price level, although national statistical offices often use more elaborate weighting methods to reflect substitution, quality change, and the differing importance of goods in household budgets. Other indices answer different questions. The PPI tracks prices received by producers and can reveal cost pressures before they reach consumers, while the GDP deflator compares nominal and real output to give a broader economy-wide view. These measures do not always move together in the short run, because supply chains, import costs, and sector-specific shocks can separate producer prices from retail prices. That is why there is no single perfect measure of inflation, only measures suited to different analytical purposes. Why prices rise: the main schools of thought Economists usually explain inflation through several overlapping channels rather than one universal cause. The quantity theory of money argues that, other things equal, faster money growth eventually feeds through into higher prices, often summarised by the idea that too much money chases too few goods. In this view, inflation is fundamentally monetary, and sustained episodes of high inflation are closely linked to weak monetary discipline. Demand-pull explanations focus on excess spending. If aggregate demand rises faster than the economy's capacity to supply goods and services, firms can raise prices because buyers compete for limited output. Cost-push explanations begin from the other side of the market: if wages, raw materials, transport, or energy become more expensive, firms may pass those costs on to consumers. Structural theories add that weak infrastructure, poor logistics, or bottlenecks in production can make inflation persistent even when conventional demand pressures are modest. These schools are not mutually exclusive; in real economies, inflation often reflects a mixture of them. A useful way to think about the process is through firms' pricing behaviour. If a business faces higher wages or imported inputs, it may set a new price based on expected costs and desired margins rather than on last period's price alone. That is why inflation can become self-reinforcing when workers seek pay rises to preserve living standards and firms then lift prices to protect margins. The result is a wage-price dynamic, often called built-in inflation, which can keep the price level rising even after the original shock has faded. Purchasing power and real incomes The most immediate effect of inflation is erosion in purchasing power. If prices rise faster than wages, savings, or pension income, households can afford fewer goods and services in real terms. The concept of real income adjusts nominal income for price changes, which is why a pay rise is not automatically a gain in living standards unless it exceeds inflation. This distinction explains why inflation can feel damaging even when headline wages are rising. For savers, inflation also creates a hidden tax on idle cash balances. A nominal balance of loses real value when prices rise, because the purchasing power of that balance is roughly , where is the price level. If increases more quickly than the return on deposits, the real value of wealth declines. That is one reason inflation reshapes portfolio choices, debt burdens, and long-term retirement planning. Debates about what inflation really measures One debate concerns whether inflation is best treated as a cause or a symptom. Monetarist interpretations emphasise money growth and expectations, whereas Keynesian and supply-side interpretations place more weight on demand conditions, production constraints, and administered prices. In practice, central banks and economists usually accept that all of these channels can matter, but they differ on which mechanism dominates in a given episode. Another debate concerns the reliability of price indexes. A fixed basket can overstate inflation if consumers switch to cheaper alternatives when prices change, while quality improvements can make the true cost of living rise more slowly than raw sticker prices suggest. There is also the issue of timing: PPI changes may feed into CPI with lags, but the pass-through is incomplete and varies by sector, trade structure, and market power. As a result, inflation measurement is not just technical bookkeeping; it is an interpretation problem about what kind of price change matters most for welfare and policy. Why inflation still matters Inflation remains central because it affects contracts, interest rates, real wages, public finance, and distributional outcomes. Debtors often benefit from unanticipated inflation, while creditors and cash holders lose unless nominal rates adjust quickly. Governments also care because tax systems, benefit formulas, and public debt servicing can all become more or less burdensome depending on how inflation evolves. For policy, the challenge is not to eliminate inflation entirely but to keep it predictable and low enough that prices can still adjust smoothly without destabilising planning. Too little inflation can signal weak demand or even deflationary pressure, while too much can damage savings, distort relative prices, and unsettle expectations. That balance is why inflation remains one of the most watched indicators in economics, and why debates over CPI, PPI, monetary policy, and cost-of-living pressures continue to shape both academic work and everyday economic life.
|
| |
| |
Global Advisors News Brief - July 16 2026Read the full brief at the link Headlines for the last 24hrs
Time window: 2026-07-15T05:00:33.075Z to 2026-07-16T05:00:33.075Z |
| |
| |
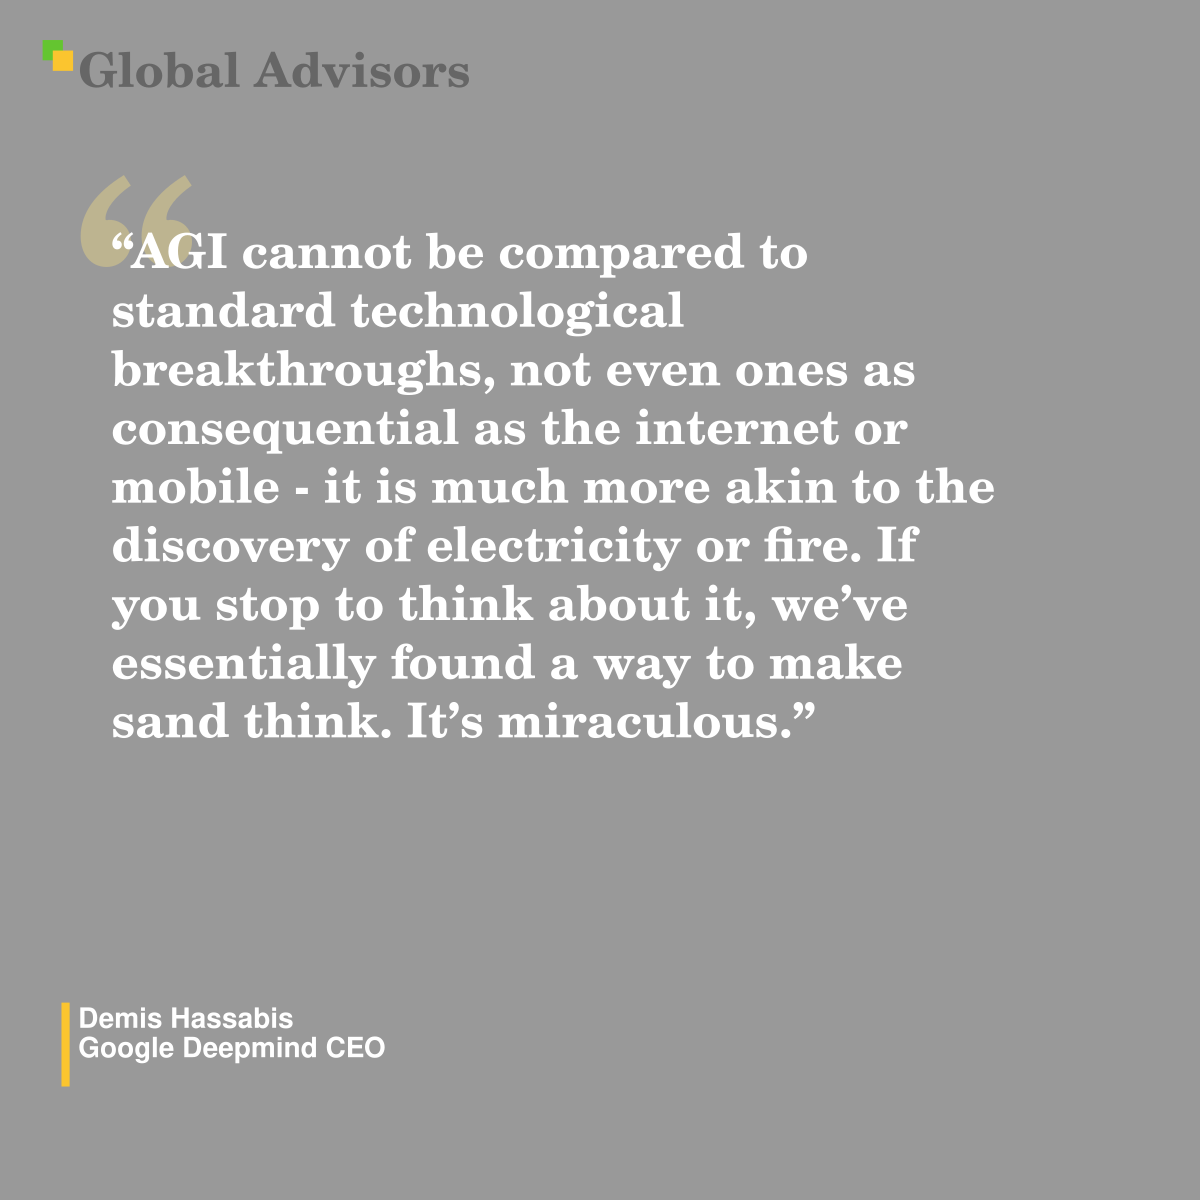
Quote: Demis Hassabis - Google Deepmind CEO"AGI cannot be compared to standard technological breakthroughs, not even ones as consequential as the internet or mobile - it is much more akin to the discovery of electricity or fire. If you stop to think about it, we've essentially found a way to make sand think. It's miraculous." - Demis Hassabis - Google Deepmind CEO The claim that contemporary AI research is converging on a transformation comparable to humanity harnessing electricity or fire rests on a tension between incremental technical progress and discontinuous civilisational impact. On one side sit the familiar patterns of technological diffusion: products launched, infrastructure scaled, regulations negotiated, and productivity gains compounding over decades. On the other side is the suggestion that when machine intelligence becomes general, cheap and widely deployed, it behaves less like another industrial tool and more like a new kind of capability layer for civilisation, reconfiguring how knowledge, labour and governance function. Demis Hassabis positions artificial general intelligence as belonging squarely in this second category, arguing that its arrival would mark the start of a new human era rather than just another technology cycle. From Narrow Tools To General Reasoning Engines Understanding the statement requires distinguishing current AI systems from the envisaged general intelligence. Today's models already rival or surpass humans on a narrow band of cognitive tasks: solving competition-level mathematics, generating code, and parsing multimodal inputs at scale. Yet Hassabis consistently stresses their deficits: inconsistent performance, weak long-term planning, limited creativity, and an inability to autonomously generate and test novel scientific hypotheses. His benchmark for AGI is not a supercharged autocomplete but a system exhibiting the full suite of human cognitive capabilities with robust, reliable behaviour across domains. In other interviews, he frames the missing capabilities as fewer than five fundamental breakthroughs: world models, continuous learning, extended planning, and the elimination of jagged intelligence where systems oscillate between superhuman and childlike errors. The claim that AGI resembles fire or electricity rather than the internet or mobile phones hinges precisely on this shift from tool to general reasoning substrate. Fire turned latent chemical energy into controllable heat and light, underpinning cooking, metallurgy and eventually industrial processes. Electricity transformed natural phenomena into universally routable energy, enabling everything from lighting to computation. In Hassabis's framing, general intelligence recast as an engineered system would similarly turn latent patterns in data and physical processes into universally accessible problem-solving capacity. By compressing cognition into reproducible algorithms, it promises to make reasoning itself a deployable resource rather than a scarce human trait. Sand That Thinks: The Material Substrate Of Intelligence The metaphor of making sand think draws attention to the physical strangeness of modern computing. Silicon, an abundant element in ordinary sand, becomes the substrate for digital logic through fabrication processes that etch transistors measured in nanometres into integrated circuits. These circuits are then orchestrated to manipulate symbolic representations under deterministic rules. What Hassabis highlights is the philosophical dislocation: arrangements of silicon switches now emulate aspects of neural computation to the point of solving tasks once reserved for human brains. In practical terms, what makes this vivid is the scale of computation deployed for frontier models. Training runs for leading systems involve clusters delivering on the order of hundreds of thousands of accelerator chips, each executing trillions of floating-point operations per second over months. If AGI emerges from further scaling and architectural refinements, then a global infrastructure of data centres effectively becomes a planetary cognition engine. The metaphor of thinking sand captures both humility and alarm: humble, because the substrate is inert matter guided by human-designed algorithms; alarming, because once those algorithms reach generality, they embody a new class of agentic processes that operate at digital speed and scale. Factual Context: Hassabis's Timelines And Impact Estimates Hassabis has, over several years, converged on the view that AGI is relatively near-term and vastly consequential. In talks and interviews he sets timelines of three to five years, or roughly by 2030 plus or minus a year, for systems reaching human-level general intelligence. He couples these timelines with quantitative impact estimates: AGI could deliver roughly ten times the impact of the Industrial Revolution, compressed into a decade instead of a century. That framing is not a precise forecast but an attempt to convey acceleration: whereas industrialisation unfolded over 100 years, with lagged adoption across sectors and geographies, digital intelligence can propagate as fast as infrastructure and policy allow. Importantly, Hassabis rarely presents this trajectory as unambiguously positive. He speaks of a new human era that could unlock scientific breakthroughs in medicine, energy and fundamental physics, while simultaneously emphasising existential risks and the need for robust safety research and regulatory frameworks. His public stance pairs what he calls cautious optimism with repeated warnings that society has very little time to prepare institutional responses before general systems become operational. That duality informs the electricity and fire analogy: both discoveries enabled extraordinary progress and catastrophic misuse, from industrial productivity to weaponised combustion and electrocution. Strategic And Technological Tensions Treating AGI as a fire-or-electricity scale event surfaces several strategic tensions that differ from earlier technology cycles. First, there is the race dynamic. If general intelligence is achievable within a handful of years, frontier labs and nation states have powerful incentives to accelerate research to secure economic and security advantages. Yet safety work, standards and governance mechanisms operate on slower political and bureaucratic timescales. Hassabis explicitly worries that agents and proto-AGI systems now being deployed are a practice run that offers only a narrow window to get guardrails in place before capabilities sharply increase. Second, there is the infrastructure question. Electricity required vast investment in generation, transmission and distribution networks over decades. AGI not only sits on top of existing digital and electrical infrastructure but drives demand for more, particularly high-density data centres and specialised chips. That generates geopolitical competition over semiconductor supply chains and energy availability, as well as environmental debates about the power consumption and carbon footprint of large-scale training. If intelligence behaves like a general-purpose technology similar to electrification, governments may need to treat AI compute and safety oversight as critical infrastructure, with direct public investment and regulation rather than leaving it entirely to private labs. Debates, Objections And Alternative Analogies The analogy to fire and electricity is contested. Some analysts argue that contemporary AI more closely resembles electricity as a slowly diffusing general-purpose technology than a sudden singularity event. On this view, the transformative potential lies in gradual augmentation of human capabilities across sectors, not in the emergence of autonomous general agents that displace human judgement. They point to historical electrification, which, while profound, required multi-decade infrastructure build-out, regulatory adaptation and cultural acceptance. The internet and mobile revolutions, though rapid in consumer terms, still unfolded over years and required complementary organisational and legal changes; AGI may similarly depend on institutional capacity building rather than simply model scaling. Others question whether current technical trajectories can deliver genuine general intelligence within the stated timelines. Hassabis himself acknowledges that major gaps remain: systems lack stable reasoning across long horizons, struggle with hierarchical planning, and sometimes fail at tasks trivial for children while excelling at advanced coding. Critics suggest these deficits might not yield to more data and compute, requiring deeper architectural rethinks or new theoretical breakthroughs. If that is right, then AGI is less a straightforward extrapolation of scaling trends and more a research frontier with uncertain timescales. The contention that we are a few years away rests partly on Hassabis's insider view that the field has identified the right technical path and is now filling in missing pieces. Why The Framing Matters Regardless of whether one accepts the fire and electricity analogy, its adoption by a leading AI lab head has practical consequences. First, it shapes regulatory expectations. Policymakers hearing AGI described as a new human era or a tenfold Industrial Revolution may treat it as a national priority on par with climate policy or defence modernisation, triggering dedicated safety institutes, compute oversight frameworks, and cross-border coordination. Second, it influences investment and public narrative. Comparing AGI to world-historic inventions legitimises massive capital allocation to frontier research while heightening public anxiety about job displacement, surveillance, and existential risk. Third, the metaphor affects how technologists conceptualise their own responsibility. Fire and electricity were harnessed through a mixture of scientific insight, engineering discipline and social regulation. If AGI is of comparable magnitude, frontier labs cannot treat safety and alignment as peripheral features; they must be treated as constitutive parts of system design and deployment. Hassabis's appeal to cautious optimism implies that embracing transformative potential carries a duty to anticipate failure modes, from misinformation and automated cyberattacks to loss of human control over strategic decision systems. By casting general intelligence as thinking sand, he underscores both the miraculous compression of cognition into silicon and the fragility of assuming such systems will remain docile tools. Finally, the framing matters for ordinary citizens who will live through any transition. The internet and mobile eras reshaped communication and commerce but largely preserved human centrality in decision-making. Framing AGI as analogous to fire or electricity signals a scenario where cognitive labour itself becomes ubiquitously automated, challenging educational models, employment structures and political representation. Whether that future arrives on a three- to five-year or longer horizon, Hassabis's statement invites society to treat frontier AI not as another app layer but as a candidate for civilisational infrastructure, demanding scrutiny commensurate with its promised power.
|
| |
| |
Global Advisors News Brief - July 15 2026Read the full brief at the link Headlines for the last 24hrs
Time window: 2026-07-14T05:00:33.074Z to 2026-07-15T05:00:33.074Z |
| |
| |
|


| |
| |