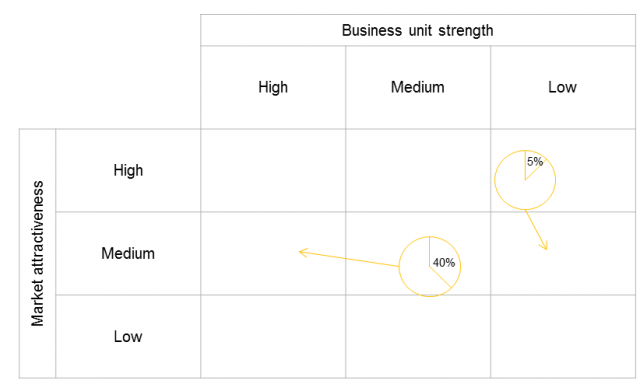
The GE matrix is a nine cell portfolio matrix first developed by General Electric in the 1970s which was used as a tool for screening large portfolios of business units or product lines. It is based on the idea that determining an appropriate level of investment for a business depends on both the attractiveness of the market and the businesses current capability in that market. Industry attractiveness and business unit strength are calculated by identifying a number of criteria and applying a weighting to each to come to a combined figure for its positioning on the graph. It is similar to the growth-share matrix in that it maps the strategic business units relative to their position within the industry. The axes of industry attractiveness and business unit strength are comparable to the market growth and market share axes of the growth-share matrix. The tool could be used to decide what products or business units should be added to or removed from a portfolio or which markets to exit/enter, and as a result how investment should be prioritised across the business.
The factors to consider when plotting the circles could include1,3:
Industry attractiveness
|
Business unit strength
|
For simple plotting of the matrix you could use a single point for each business unit/product, or you could use the circle to convey additional information1:
- Market size can be represented by the size of the circle
- Market share can be indicated by using the circle as a pie chart
- The expected future position of the circle can be indicated by an arrow
Strategic implications
The GE matrix can be used for resource allocation, such as deciding to grow, hold or harvest a position. There are related strategic decisions that need to be made based on this.
A few questions you may want to ask yourself include:
- How are our resources allocated?
- What do you want to do with the money? (Optimum allocation will depend on the business unit, life stage etc.
- Could you possibly move the circle to a different area on the grid? If so, how?
- What are the strategic decisions that need to be made based on this?
The key to this process is that the result will only be as good as the information that is provided to plot the circles. Bad data will result in bad resource allocation decisions. One of the shortcomings of the matrix is that it does not consider interactions between business units and does not consider the competencies required to create value. As a result this matrix should be used as a component of the resource allocation process and should never be the only process that is followed. Additional frameworks could assist in this process in helping to build a clearer picture of the industries attractiveness or the business unit/product strength.
Source: 1 Anonymous – “GE/McKinsey Matrix” – Strategy – Quick MBA – http://www.quickmba.com/strategy/matrix/ge-mckinsey/ – accessed on 28 November 2013
2 Anonymous – “The GE Matrix” – Changing Minds.org – http://changingminds.org/disciplines/marketing/understanding_markets/ge_matrix.htm – accessed on 28 November 2013
3 Anonymous – “Summary of the GE matrix” – Value Based Management.net – http://www.valuebasedmanagement.net/methods_ge_mckinsey.html – accessed on 28 November 2013


