
Logic suggests that high relative market share (RMS) should translate into higher profitability (unless the firm was not using its potential advantages or pricing to penetrate the market further). This suggests that a “normative curve / band” exists to describe this phenomenon i.e. the expected profitability of the average business segment in a particular industry according to normal expectations conditional on the segment’s relative market share. This normative band is shown in the figure below as the area between the two curves.
The Opportunity / Vulnerability Matrix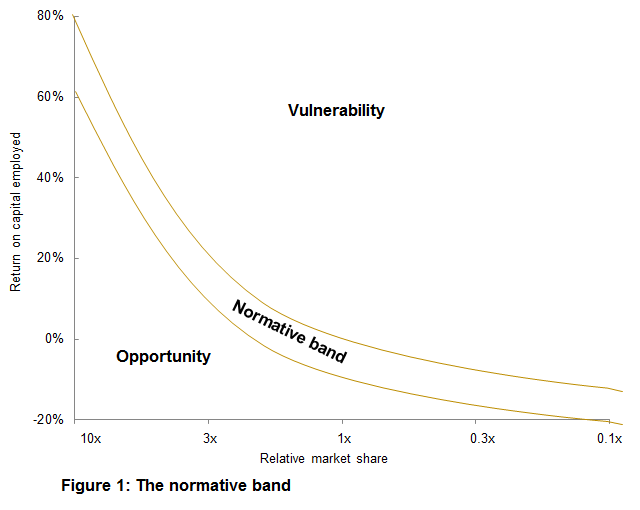
The curve is best explained using data / businesses that have been correctly segmented. In practice such data can only be obtained after analysing the organisation and having a good understanding of any relationships. The band used to be shown coloured yellow, hence the chart became known as a “bananagram”.
The implication of the curve is that high relative market share positions, correctly segmented, are valuable segments / businesses. Managers should therefore strive to achieve / participate in these segments / businesses.
Another implication, in some ways obscured focusing primarily on the growth share matrix (especially where “dogs” are concerned), is that it is useful to improve relative market share in a business segment whatever the starting position. The bananagram enables one to calculate a rough estimate of the equilibrium profitability to be expected from any particular position (relative market share). Therefore it is possible to estimate the potential benefit of moving any particular segment position against the cost of doing so – extra marketing spend, product development or lower prices. This allows one to quantitatively assess whether it is worth trying to raise RMS and which segment / business investments give the best return to shareholders.
Empirical evidence suggests that the majority of observations would fall between the two curved lines and it would be unusual for businesses to fall outside this band. There are two possible positions where a business segment can find itself outside of the two curved lines – this is depicted in the figure below.
The Opportunity / Vulnerability Matrix – Example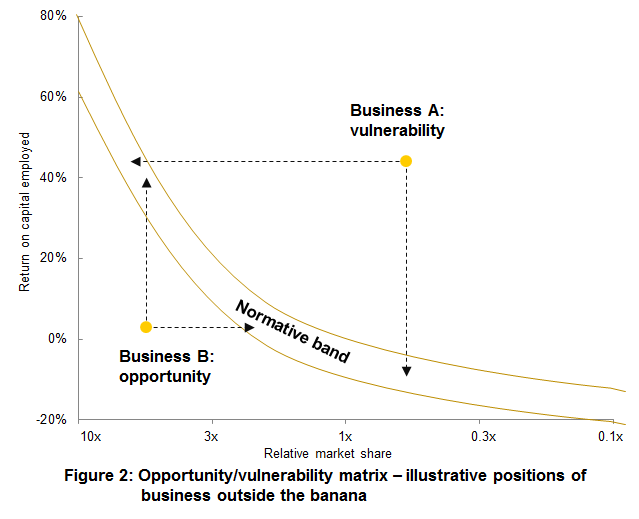
Business A is earning (for example) 45 per cent return on net capital employed, a good return, but is in a weak relative market share position (say 0,5x, or only half the size of the segment leader). The theory and empirical data from the matrix suggests that the combination of these two positions is at best anomalous, and probably unsustainable. Business A is therefore in the “vulnerability” part of the matrix. The expectation must be that in the medium term, either the business must improve its relative market share position to sustain its profitability (the dotted arrow moving left), or that it will decline in profitability (to about break-even). Why should this happen? Well, the banana indicates that the market leader in this business may well be earning 40 percent or even more ROCE in the segment. What may be happening is that the leader is holding a price umbrella over the market, that is, is pricing unsustainably high, so that even the competitors with weak market share are protected from normal competition (especially where pricing is concerned). What happens if the market leader suddenly cuts prices by 20 percent? They will still earn a good return, but the weaker competitors will not. The leader may opt to provide extra product benefits or services, instead of lowering prices, but the effect would still be a margin cut. It is as well to know that business A is vulnerable. If relative market share cannot be improved, it is sensible to sell it before the profitability declines.
Now let’s look at business B. This is a business in a strong relative market share position – the leader in its segment, five times larger than its nearest rival. It is earning 2 percent ROCE. This is a wonderful business to find. The theory and practical data suggest that such a business should be making 40 percent ROCE, not 2 percent. Nine times out of ten when such businesses are found, it is possible to make them very much more profitable, usually by radical cost reduction (often involving restructure), but sometimes through radical improvement of service and product offering to the customer at a low extra cost to the supplier, but enabling a large price hike to be made. Managements of particular businesses very often become complacent with historical returns and think it is impossible to raise profits in a step function to three, four or five times their current level. The bananagram challenges that thinking for leadership segment positions, and usually the bananagram is proved right. After all, high relative market share implies huge potential advantages; but these must be earned and exploited, as they do not automatically disgorge huge profits.
Source: Koch, R – “The Financial Times Guide to Strategy” – Fourth edition – Prentice Hall – page 313-316
