By Marc Wilson
Marc is a partner at Global Advisors and based in Johannesburg, South Africa
This article is part of a Global Advisors series on strategy tools:
https://globaladvisors.biz/category/strategy-tools
Download this article:
Please fill in your details below and you will instantly be sent a link to download the “Strategy Tools: The Growth-Share Matrix” article.
(Also known as the product portfolio matrix, Boston Box, BCG-matrix, Boston matrix, Boston Consulting Group analysis, portfolio diagram)
The Growth-Share Matrix was introduced almost 50 years ago by Bruce Henderson and the Boston Consulting Group (BCG). It is considered one of the most iconic strategic planning techniques.
The Growth-Share Matrix is a framework first developed in the 1960s to help companies think about the priority (and resources) that they should give to their different businesses. At the height of its success, in the late 1970s and early 1980s, the Growth-Share Matrix (or approaches based on it) was used by about half of all Fortune 500 companies, according to estimates.
Background
The need which prompted The Growth-Share idea was, indeed, that of managing cash-flow. It was reasoned that one of the main indicators of cash generation was relative market share, and one which pointed to cash usage was that of market growth rate:
'To be successful, a company should have a portfolio of products with different growth rates and different market shares. The portfolio composition is a function of the balance between cash flows. High growth products require cash inputs to grow. Low growth products should generate excess cash. Both kinds are needed simultaneously.'—Bruce Henderson.
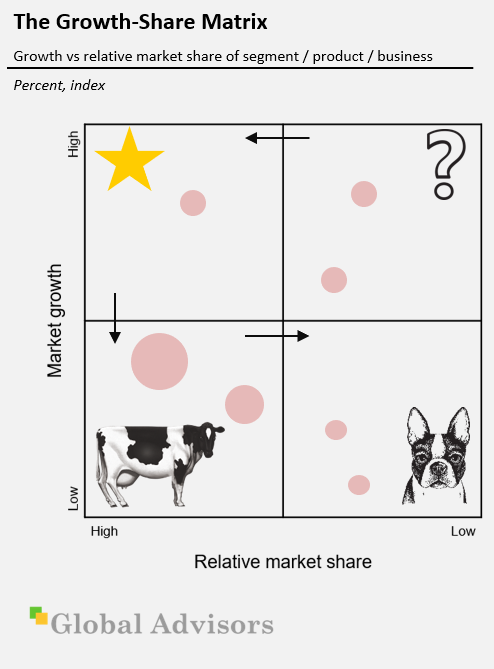
The two axes of the matrix are relative market share (or the ability to generate cash) and growth (or the need for cash).
For each product or service, the 'area' of the circle represents the value of its sales. The growth–share matrix thus offers a 'map' of the organization’s product (or service) strengths and weaknesses, at least in terms of current profitability, as well as the likely cashflows.
The matrix puts each of a firm’s businesses into one of four categories. The categories were all given memorable names – cash cow, star, dog and question mark – which helped to push them into the collective consciousness of managers all over the world.
- Cash cows are businesses that have a high market share (and are therefore generating lots of cash) but low growth prospects (and therefore a low need for cash). They are often in mature industries that are about to fall into decline.
- Stars have high growth prospects and a high market share.
- Question marks have high growth prospects but a comparatively low market share.
- Dogs are low on both growth prospects and market share.
Only a diversified company with a balanced portfolio can use its strengths to truly capitalize on its growth opportunities
BCG
1970
BCG stated in 1970:
'Only a diversified company with a balanced portfolio can use its strengths to truly capitalize on its growth opportunities. The balanced portfolio has:
- stars whose high share and high growth assure the future;
- cash cows that supply funds for that future growth; and
- question marks to be converted into stars with the added funds.'
As a particular industry matures and its growth slows, all business units become either cash cows or dogs. The natural cycle for most business units is that they start as question marks, then turn into stars. Eventually, the market stops growing; thus, the business unit becomes a cash cow. At the end of the cycle as commoditisation and competition increases, the cash cow turns into a dog.
The utility of the matrix in practice was two-fold:
- The matrix provided conglomerates and diversified industrial companies with a logic to redeploy cash from cash cows to business units with higher growth potential. This came at a time when units often kept and reinvested their own cash—which in some cases had the effect of continuously decreasing returns on investment. Conglomerates that allocated cash smartly gained an advantage.
- It also provided companies with a simple but powerful tool for maximizing the competitiveness, value, and sustainability of their business by allowing them to strike the right balance between the exploitation of mature businesses and the exploration of new businesses to secure future growth.
The matrix helped companies decide which markets and business units to invest in on the basis of two factors – company competitiveness and market attractiveness – with the underlying drivers for these factors being relative market share and growth rate, respectively. The logic was that market leadership, expressed through high relative share, resulted in sustainably superior returns. In the long run, the market leader obtained a self-reinforcing cost advantage through scale and experience that competitors found difficult to replicate. High growth rates signalled the markets in which leadership was most attractive.
Theoretical basis
The Growth-Share strategy for successfully managing a portfolio of products was based on taking advantage of learning curves (or the experience curve) and the product life cycle.
According to this product life-cycle model, firms use profits from established cash cow products to fund increased production of early-stage problem child and rising star products.
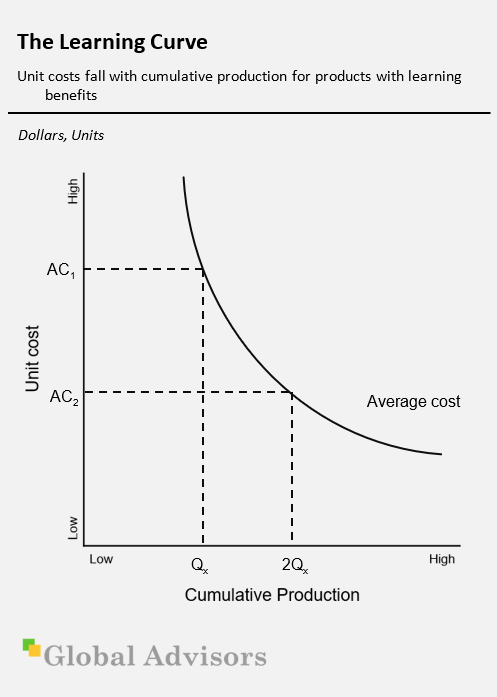
Individuals and firms often improve their production processes with experience. This is known as learning. In processes with substantial learning benefits, firms that can accumulate and protect the knowledge gained by experience can achieve superior cost and quality positions in the market.
The learning curve (or experience curve) refers to advantages that flow from accumulating experience and know-how. It is easy to find examples of learning. A manufacturer can learn the appropriate tolerances for producing a system component. A retailer can learn about its customers' tastes. An accounting firm can learn the idiosyncrasies of its clients' inventory management. The benefits of learning manifest themselves in lower costs, higher quality, and more effective pricing and marketing.
Economies of scale refer to the advantages that flow from producing a larger output at a given point in time.
Economies of learning differ from economies of scale. Economies of scale refer to the ability to perform an activity at a lower unit cost when it is performed on a larger scale at a particular point in time. Learning economies refer to reductions in unit costs due to accumulating experience over time and can be independent of current scale of the activity.
Economies of scale may be substantial even when learning economies are minimal. This is likely to be the case in simple capital-intensive activities, such as two-piece aluminium-can manufacturing.
Similarly, learning economies may be substantial even when economies of scale are minimal.
Managers who do not correctly distinguish between economies of scale and learning may draw incorrect inferences about the benefits of size in a market.
Besanko
2004
Managers who do not correctly distinguish between economies of scale and learning may draw incorrect inferences about the benefits of size in a market. For example, if a large firm has lower unit costs because of economies of scale, then any cutbacks in production volume will raise unit costs. If the lower unit costs are the result of learning, the firm may be able to cut current volume without necessarily raising its unit costs (depending on the rate of forgetting.)
To take another example, if a firm enjoys a cost advantage due to a capital-intensive production process and resultant scale economies, then it may be less concerned about labour turnover than a competitor that enjoys low costs due to learning a complex labour-intensive production process.
Learning economies cement the advantages of rising stars, which eventually mature into cash cows and help renew the investment cycle. BCG deserves credit for recognizing the strategic importance of learning curves.
The Growth-Share matrix promotes portfolio diversification in order to balance cash flow generation and utilisation. This diversification may be across segments or products within a fairly narrow market. Managers have typically interpreted this far more broadly, however. Economies of scope provide the principal rationale for broader diversification. These economies can be based on market and technological factors as well as on managerial and shared service synergies. Although there may be little opportunity to spread fixed production costs across businesses like automobiles and pharmaceuticals, scope economies can come from spreading a firm's underutilized organizational resources to new areas.
In particular, C. K. Prahalad and Richard Bettis (1986) suggest that managers of diversified firms may spread their own managerial talent across business areas that do not seem to enjoy economies of scope. They call this a 'dominant general management logic,' which comprises 'the way in which managers conceptualize the business and make critical resource allocations — be it in technologies, product development, distribution, advertising, or in human resource management.'
In our experience, when diversification is encouraged, economies of scope are almost always overestimated – and as a result, talent is almost always spread too thin.
Global Advisors
The dominant general management logic may seem at odds with the notion of diseconomies of scale that result when talent is spread too thin – management would have to believe that these are outweighed by the gains from spreading underutilized resources. In our experience, when diversification is encouraged economies of scope are almost always overestimated – and as a result, talent is almost always spread too thin.
Firms may diversify in order to make use of an internal capital market. This is far more in line with the cash allocation logic of the Growth Share Matrix. Combining a cash-rich business and a cash-poor business into a single firm allows profitable investments in the cash-poor business to be funded without accessing external sources of capital. The internal capital market describes the allocation of available working capital within the firm, as opposed to the capital raised outside the firm via debt and equity markets. To understand the role of internal capital markets in diversification, suppose that a cash-rich business and a cash-constrained business operate under a single corporate umbrella. The central office of the firm can use proceeds from the cash-rich business to fund profitable investment opportunities in the cash-constrained business. Thus, the diversified firm can create value in a way that smaller focused firms cannot, provided that diversification allows the cash-constrained business to make profitable investments that would not otherwise be made, for example, by issuing debt or equity. This idea forms the basis of the Growth/Share paradigm.
A firm is diversified if it produces for numerous markets. Most large and well-known firms are diversified to some extent.
Critical success factors / risks
It would be a mistake to apply the Growth-Share framework without considering its underlying principles.
Learning curves are by no means ubiquitous or uniform where they do occur. At the same time, product life cycles are easier to identify after they have been completed than during the planning process. Many products ranging from nylon to the Segway personal transporter that were forecast to have tremendous potential for growth did not meet expectations.
Where diversification has been effective, it has been based on economies of scope among businesses that are related in terms of technologies or markets. More broadly diversified firms have not performed well.
Besanko
2004
Perhaps the most controversial element of the Growth-Share framework is the role of the firm as 'banker.' Recall that diversification allows businesses access to a corporation's working capital. Thus, the central office of the corporation must act like a banker, deciding which businesses to invest in. Given the sophistication of modern financial markets, one wonders if firms must really rely on 'cash cows' to find capital to fund their 'rising stars.'
Jeremy Stein (2003) argues that the answer to this question may well be yes, for several reasons. First, a firm may find it difficult to find external providers willing to fund new ventures due to asymmetric information. Firms seeking to expand usually know more about their prospects for success than potential bond- and equity holders outside the firm. Outsiders may suspect that firms disproportionately seek outside funding for questionable projects, saving their internal working capital for the most promising projects. When firms seek outside funding for projects that they believe are truly worthwhile, they can be met with scepticism and high interest rates. Second, outsiders will be reluctant to provide capital to firms that have existing debt. This is because new debt and equity are typically junior to the existing debt, which means that existing bondholders have first dibs on any positive cash flows. Third, external finance consumes monitoring resources, for bond- and equity holders must ensure that managers take actions that serve their interests. If external finance is costly, then firms without adequate internal capital may have to forego profitable projects. Thus, firms may benefit by having their own 'cash cows' to fund 'rising stars' even if they are in unrelated businesses. The benefits of using an internal capital market may extend to human capital, that is, labour. As John Roberts observes, firms usually have good information about the abilities of their workers, and large diversified firms may have greater opportunities to assign their best workers to the most appropriate and most challenging jobs. This may help explain the success of diversified business groups in developing nations, such as Mexico's Grupo Carso SAB.
Diversification may reflect the preferences of a firm's managers rather than those of its owners. If problems of corporate governance prevent shareholders from stopping value-reducing acquisitions, managers may diversify in order to satisfy their preference for growth, to increase their compensation, or to reduce their risk.
The market for corporate control limits managers' ability to diversify unprofitably. If the actual price of a firm's shares is far below the potential price, a raider can profit from taking over the firm and instituting changes that increase its value.
Research on the performance of diversified firms has produced mixed results. Where diversification has been effective, it has been based on economies of scope among businesses that are related in terms of technologies or markets. More broadly diversified firms have not performed well.
Application of the Growth-Share Matrix
In our experience, one of the most critical questions relevant to the use of the Growth-Share Matrix is the one most often overlooked. While Bruce Henderson and BCG's original application typically refers to Business Unit and product level, our experience shows that a far more useful application is at a business segment level.
At what level of the organisation should the analysis be conducted? Ideally, at all the strategic business levels. And at the lowest level it should include each product (by its positioning, if possible) by market segment. Such thoroughness, however, takes much management time and requires huge quantities of data.
On the other hand, the aggregation of product-market segments may mean that they fall into a misleading 'average' position in the portfolio, which, in turn, may cause inappropriate strategy designation.
Consider the case of a manufacturer of (among other products) shampoo, shaving cream, bath soap, tooth-paste, and other personal care items for which a single strategic business unit (SBU) is responsible. The company has constructed a growth/share matrix designating this SBU as a cash cow. Now, clearly this designation may be inappropriate for each line in the product mix and, further, for each item in the line. So, aggregation may lead to erroneous positioning in the portfolio matrix as well as to poor resource allocation and strategy recommendations.
A typical five-level portfolio approach might have the following levels: product, product line, market segment, SBU, and business sector.
Wind
1981
A hierarchical structure of portfolios would start at the level of the product line (or product group or division), proceed through the product mix of one SBU to the mix of several SBUs, and culminate at the corporate level, which would, of course, include all lower-level portfolios. This would permit evaluation of relevant strategies at the different levels of analysis and assist in designation and allocation of resources to SBUs and product lines. A typical five-level portfolio approach might have the following levels: product, product line, market segment, SBU, and business sector.
Related to the analysis level is the desired extent of market segmentation and product positioning. Portfolio analysis should be undertaken first in every relevant market segment and product position, then at higher levels across the positionings of the various product-market segments, and finally—if the company is multinational—across countries and modes of entry (such as export, licensing, and joint ventures).
The issue here is: When does it become meaningful to divide the total market into segments? And when to divide the products into specific positionings? The answers become complicated when the market boundaries cannot be identified easily. The risk of aggregating market segments and product positionings is high. Detailed positioning/segment-level portfolio analysis is necessary for higher-level portfolio examination. Without it, the value of recommendations for corporate-level portfolios is questionable, especially when the units are heterogeneous with respect to their perceived positioning and intended market segments.
The marketer must take into account consumers' perceptions, their preference for and usage of the various products, their desire for variety, their inventorying activity (for example, hoarding when they expect a price increase), and the multi-person nature of consumption in most households. Traditional approaches to portfolio analysis tend to ignore the consumer and concentrate on product performance. The two foci of analysis are not alternatives but complementary diagnostic tools.
After adding the second dimension of investigation – markets – to its portfolio analysis, management should evaluate and then settle on the most attractive combination of products and markets. Identification of a product-market portfolio and subsequent selection of the target markets and products are consistent with the concept and findings of market segmentation, which suggest that the demand for any product varies by segment. Resource allocation decisions should not be limited, therefore, only to allocation among products; they should also take into account the trade-offs of investing in various market segments.
Segmentation should be limited to how the firm experiences competition or by grouping those buyers who share strategically relevant situational or behavioural characteristics. (In such cases the company must use different marketing mixes to serve the identified segments, which will result in different cost and price structures.) Other manifestations of a strategically important segment boundary are a discontinuity in growth rates, share patterns, distribution patterns, and so forth.
Clearly a practitioner must make some critical decisions before selecting a definition of market share. Similar complexity faces him with the definition of any dimension. Think of product sales, of which there are at least four measures: absolute level, rate of growth, level by industry or by product class, and industry or product class rate of growth.
Relative market share (RMS)
This indicates likely cash generation, because the higher the share the more cash will be generated. As a result of 'economies of scale' or learning curve benefits (a basic assumption of the Growth-Share Matrix), it is assumed that these earnings will be higher the higher the share. The exact measure is the brand’s share relative to its largest competitor. Thus, if the brand had a share of 20 percent, and the largest competitor had the same, the RMS would be 1. If the largest competitor had a share of 60 percent, however, the RMS would be 0,3, implying that the organisation’s brand was in a relatively weak position. If the largest competitor only had a share of 5 percent, the ratio would be 4, implying that the brand owned was in a relatively strong position, which might be reflected in profits and cash flows. When this technique is used in practice, this scale is logarithmic, not linear.
On the other hand, exactly what is a high relative share is a matter of some debate. The best evidence is that the most stable position (at least in fast-moving consumer goods markets) is for the brand leader to have a share double that of the second brand, and triple that of the third. Brand leaders in this position tend to be very stable—and profitable; the Rule of 123. The selection of the relative market share metric was based upon its relationship to the experience curve. The market leader would have greater experience curve benefits, which delivers a cost leadership advantage. Another reason for choosing relative market share, rather than just profits, is that it carries more information than just cash flow. It shows where the brand is positioned against its main competitors, and indicates where it might be likely to go in the future. It can also show what type of marketing activities might be expected to be effective.
Market growth rate
Rapidly growing in rapidly growing markets, is what organisations strive for; but, the penalty is that they are usually net cash users – they require investment. The reason for this is often because the growth is being ‘bought’ by the high investment, in the reasonable expectation that a high market share will eventually turn into a sound investment in future profits.
The theory behind the matrix assumes, therefore, that a higher growth rate is indicative of accompanying demands on investment. The cut-off point is usually chosen as 10 per cent per annum. Determining this cut-off point, the rate above which the growth is deemed to be significant (and likely to lead to extra demands on cash) is a critical requirement of the technique; and one that, again, makes the use of the growth–share matrix problematical in some product areas. What is more, the evidence, from fast-moving consumer goods markets at least, is that the most typical pattern is of very low growth, less than 1 per cent per annum. This is outside the range normally considered in Growth-Share Matrix work, which may make application of this form of analysis unworkable in many markets.
Where it can be applied, however, the market growth rate says more about the brand position than just its cash flow. It is a good indicator of that market’s strength, of its future potential (of its ‘maturity’ in terms of the market life-cycle), and also of its attractiveness to future competitors. It can also be used in growth analysis.
Adoption, shortfalls, misuse and a changing environment
The Growth-Share Matrix started a fashion for matrices among management consultants. For a while no self-respecting report or theory was complete without one. Henderson and the firm he created were pioneers in thinking about corporate strategy and competition. BCG was responsible for other enduring ideas besides the Growth-Share Matrix. These included the experience curve (the idea that unit costs decline as production increases through the acquisition of experience); the significance of being market leader; and time-based competition.
Over time, portfolio planning models such as the Growth-Share Matrix were attacked and discredited by a host of different actors, and gradually fell out of favour. Major criticisms are that it is reductionist, that it oversimplifies necessary complexity, that it is overly generic, it is used mechanistically, that it is seductively framed and popular, it is applied by practitioners with modest understanding and that it is often misapplied.
The Growth-Share Matrix has been blamed for persuading companies to focus obsessively on market share.
The Economist
2009
The Growth-Share Matrix has been blamed for persuading companies to focus obsessively on market share. In a world where markets are increasingly fluid, this can blind them to the bigger picture (market myopia). If Lego, for example, considered its market to be mechanical toys, it would miss the fact that it also competes with companies such as Nintendo for a share of young boys’ attention.
As originally practiced by the Boston Consulting Group, the matrix was used in situations where it could be applied for graphically illustrating a portfolio composition as a function of the balance between cash flows. If used with this degree of sophistication its use would still be valid.
However, later practitioners have tended to over-simplify its messages. In particular, the later application of the names (question marks, stars, cash cows and dogs) has tended to overshadow all else – and is often what most students, and practitioners, remember.
This is unfortunate, since such simplistic use contains at least two major problems:
- “Minority applicability”. The cashflow techniques are only applicable to a very limited number of markets (where growth is relatively high, and a definite pattern of product life-cycles can be observed, such as that of ethical pharmaceuticals). In the majority of markets, use may give misleading results.
- “Milking cash cows”. Perhaps the worst implication of the later developments is that the (brand leader) cash cows should be milked to fund new brands. This is not what research into the fast-moving consumer goods markets has shown to be the case. The brand leader’s position is the one, above all, to be defended, not least since brands in this position will probably outperform any number of newly launched brands. Such brand leaders will, of course, generate large cash flows; but they should not be ‘milked’ to such an extent that their position is jeopardized. In any case, the chance of the new brands achieving similar brand leadership may be slim—certainly far less than the popular perception of the Growth-Share Matrix would imply.
Perhaps the most important danger is, however, that the apparent implication of its four-quadrant form is that there should be balance of products or services across all four quadrants; and that is, indeed, the main message that it is intended to convey. Thus, money must be diverted from 'cash cows' to fund the 'stars' of the future, since 'cash cows' will inevitably decline to become 'dogs'. There is an almost mesmeric inevitability about the whole process. It focuses attention, and funding, on to the 'stars'. It presumes, and almost demands, that 'cash cows' will turn into 'dogs'.
Classifying businesses according to the matrix can be self-fulfilling. Knowing that you are working for a dog is not particularly motivating, whereas working for an acknowledged star usually is. Moreover, some companies misjudge when industries are mature. This may lead them to decide that businesses are to be treated as cash cows when they are in fact stars.
One such industry was consumer electronics. Considered by many to be mature in the 1970s, it rebounded in the 1980s with the invention of the CD and the VCR. Not, however, before some companies had consigned their electronics businesses to the fate of the cash cow.
The reality is that it is that 'cash cows' that are critically important – the other elements are supporting actors. It is a foolish vendor who diverts funds from a ‘cash cow’ when these are needed to extend the life of that ‘product’.
The world has changed. Conglomerates have become far less prevalent since their heyday in the 1970s. More importantly, The Boston Consulting Group highlights that the business environment has changed.
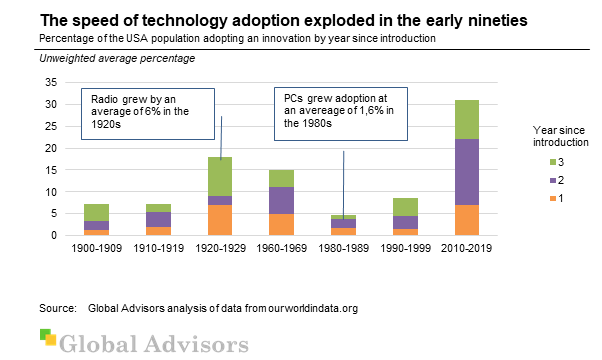
First, companies face circumstances that change more rapidly and unpredictably than ever before because of technological advances and other factors. As a result, companies need to constantly renew their advantage, increasing the speed at which they shift resources among products and business units.
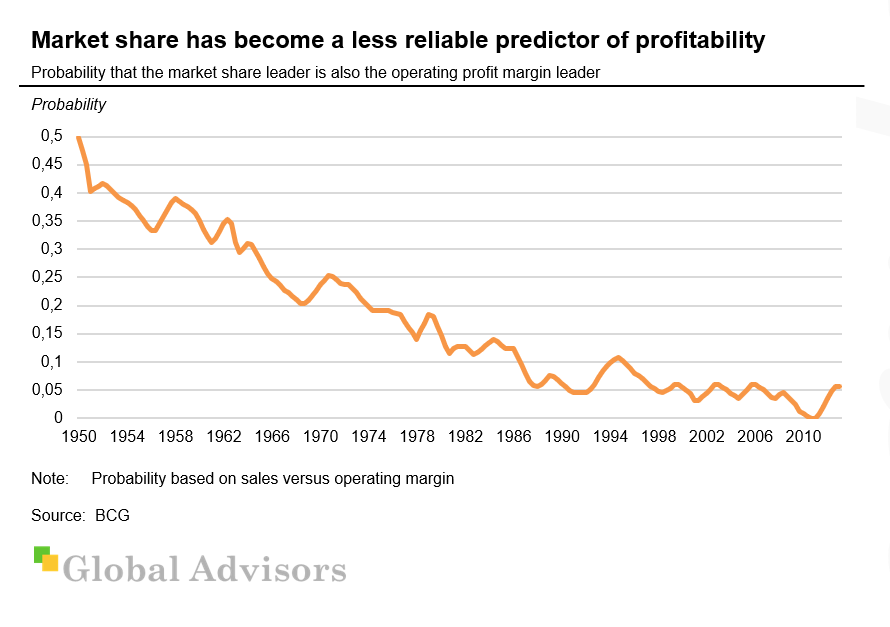
Second, market share is no longer a direct predictor of sustained performance. In addition to share, there are new drivers of competitive advantage, such as the ability to adapt to changing circumstances or to shape them.
Current use of the Growth-Share Matrix
Even though the Growth-Share Matrix is less prominent than in the past, it is still alive and has left an imprint on management education and practice. Despite being largely discredited in academic circles, many practitioners still view it as an important corporate portfolio planning technique. Research papers published after the year 2000 show that Growth-Share Matrix is still relatively widely used and that the awareness is high.
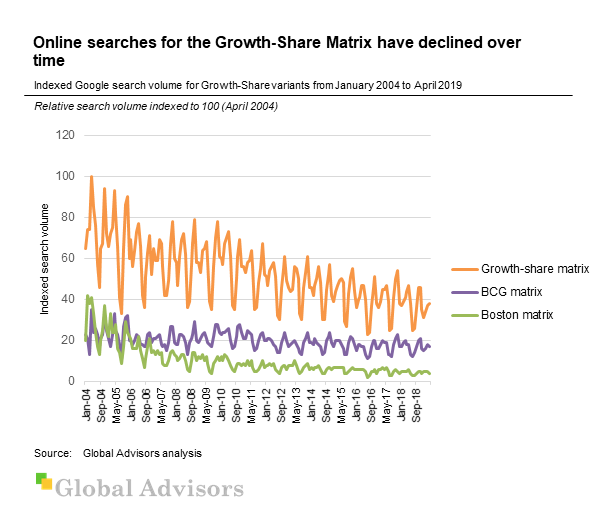
Analysis of Google searches for Growth-Share variants shows declining search volume since 2004 (the earliest data available).
Jarzabkowski and Giulietti (2007) find that portfolio matrices are currently used by 29% of organizations, while 20% have used them previously but not anymore. They also find that the awareness is high. 40% have heard of portfolio matrices but are not using them, while only 13% have not heard of such matrices at all.
Has the matrix lost its value? No, its significance has changed: it needs to be applied with greater speed and with more of a focus on strategic experimentation to allow adaptation to an increasingly unpredictable business environment. The matrix also requires a new measure of competitiveness to replace its horizontal axis now that market share is no longer a strong predictor of performance. Finally, the matrix needs to be embedded more deeply into organisation behaviour to facilitate its use for strategic experimentation.
Using the Growth Share approach with prioritisation based on adjacency mapping continuously strengthens the overall business – lending a stronger purpose to diversification.
Global Advisors
Successful companies nowadays need to explore new products, markets, and business models more frequently to continuously renew their advantage through disciplined experimentation. They also need to do so more systematically to avoid wasting resources, a function the matrix has successfully fulfilled for decades. This new experimental approach requires companies to invest in more question marks, experiment with them in a quicker and more economical way than competitors, and systematically select promising ones to grow into stars. At the same time, companies need to be prepared to respond to changes in the marketplace, cashing out stars and retiring cows more quickly and maximizing the information value of dogs.
In addition, Global Advisors finds the combined use of the Growth-Share Matrix with the Profit from the Core tool (https://globaladvisors.biz/blog/2017/11/09/profit-from-the-core) to be particularly effective. The Profit from the Core approach organises diversification by priority according to adjacency to the core business. This might show a geographic segment as a cash cow and an adjacent geography as a star – with the benefit that the diversification strengthens and leverages the cash cow rather than distracts from it. In this way, managing the business portfolio using the Growth Share matrix continuously strengthens the overall business – lending a stronger purpose to diversification.
Alternatives to the Growth-Share Matrix
The next most widely reported portfolio analysis technique is the GE Matrix (https://globaladvisors.biz/blog/2014/04/12/the-ge-matrix), which is a three-cell by three-cell matrix – using the dimensions of 'industry attractiveness' and 'business strengths'.
This approaches some of the same objectives as the Growth–Share Matrix but from a different direction and in a more complex way (which may be why it is used less, or is at least less widely taught). Our overview of the GE Matrix Strategic Tool covers the criticality of defining, weighting and scoring the criteria behind industry attractiveness and business strengths. This level of complexity and subjectivity makes the GE Matrix complex to use – but perhaps exposes the level of understanding and thought that should be applied when using the seductive 'simplicity' of the Growth-Share Matrix and its prescriptions.
Sign up to our email newsletters and receive Strategic Tools newsletters and others to your inbox! Ensure you don't miss an update: go to https://globaladvisors.biz/newsletters to sign up.
Sources
Anonymous – 'Growth–Share Matrix' – Wikipedia – https://en.wikipedia.org/wiki/Growth%E2%80%93share_matrix – accessed 28 April 2019
Besanko, D., Dranove, D., & Shanley, M. – 'Economics of strategy' – 6th Edition – 2004 – Hoboken, NJ: Wiley
Hindle, T – 'Growth-Share Matrix' – The Economist – 11th September 2009 – https://www.economist.com/news/2009/09/11/growth-share-matrix – accessed 28 April 2019
Jarzabkowski, P. & Giulietti, M. – 'Strategic management as an applied science, but not as we (academics) know it' – Paper presented at The Third Organization Studies Summer Workshop. Crete – 2017
Madsen, D.Ø. – 'Not dead yet: the rise, fall and persistence of the BCG Matrix' – Problems and Perspectives in Management, 15(1), 19-34 – 2017
Prahalad, C. K., and R. A. Bettis, 'The Dominant Logic: A New Linkage Between Diversity and Performance' – Strategic Management Journal, 7, 1986, pp. 485–501
Reeves, M; Moose, S; Venema, T – 'BCG Classics Revisited: The Growth-Share Matrix' – Boston Consulting Group – 4 June 2014 – https://www.bcg.com/publications/2014/growth-share-matrix-bcg-classics-revisited.aspx – accessed 28 April 2019
Stein, J. – 'Agency, Information and Corporate Investment' in Constantinides, G., M. Harris, and R. Stulz (eds.), 'Handbook of the Economics of Finance' – North-Holland, Amsterdam, 2003
Wind, Y; Mahajan, V – 'Designing Product and Business Portfolios' – Harvard Business Review – January 1981

